Operating System Market Share: Worldwide Long-Term Data
Operating systems come and go, and sometimes an operating system will dominate the market for a few years and then be completely replaced by a new one.
In today’s article, we’re going to take a closer look at the majority of operating systems and examine their worldwide market share over the years.
If you’re a gamer, you might be interested in the fact that Steam gamers are leaving Windows 11.
Without further ado, let’s examine the operating system market share and its changes in detail.
How did operating system market share look over the years?
Computer market share
2009 – Absolute superiority of Windows
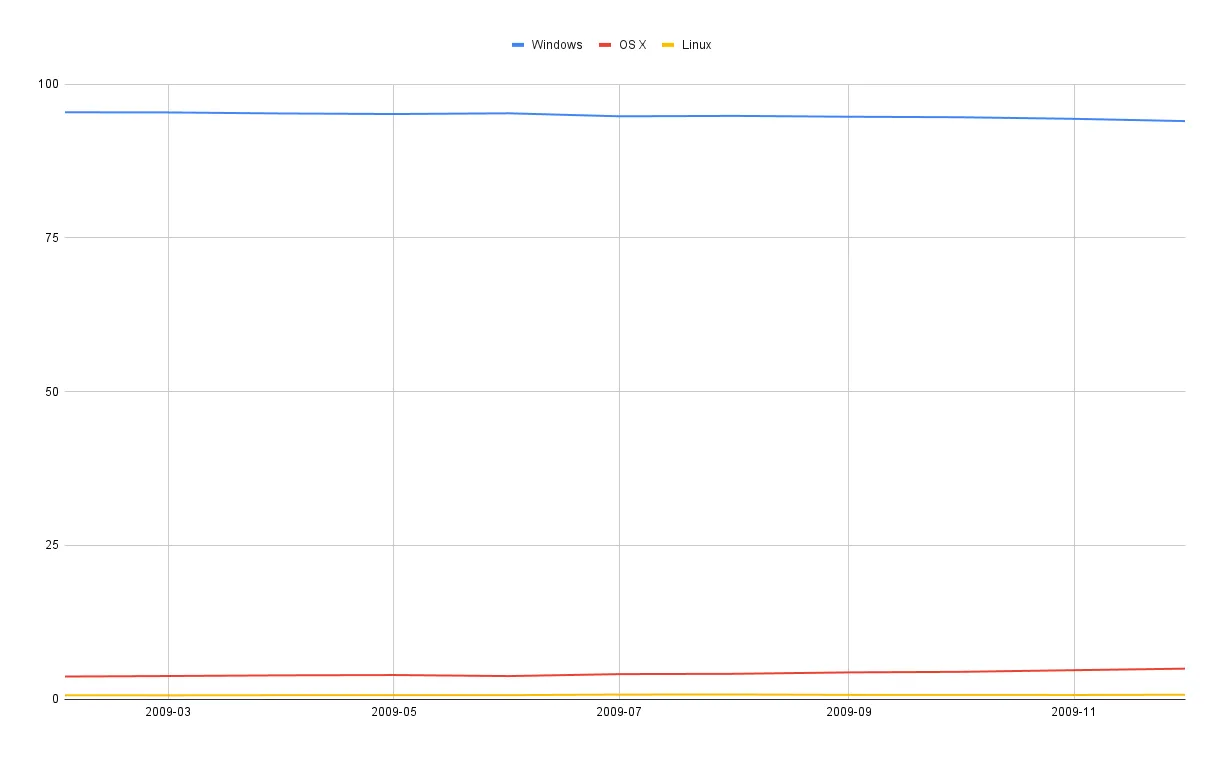
We’ll start our analysis in 2009, and in that year, Windows completely dominated the desktop market share with 95.42%.
Windows Vista experienced slow growth, from 19.93% to 25.02% in October but started to decline after that.
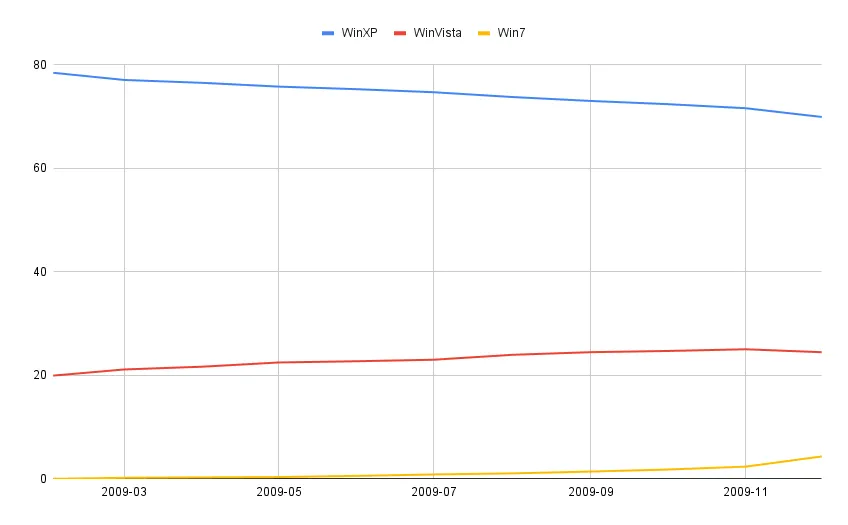
It’s no surprise since Windows 7 was on the rise; by the end of the year, it had 6.59%.
Its main competitor, macOS had only 3.68% with a slow rise by the end of the year. As for Linux, it had a negligible 0.64% of the market share.
2010 – Windows 7 is on the rise
The following year didn’t see much changes in worldwide market share, and Windows kept dominating it, and it held 92.42% by the end of that year.
macOS, on the other hand, experienced a rise in market share and by the end of the year, it had 6.25%. Regarding Linux, it had only 0.75% by the end of the year.

In 2010, Windows XP was still losing its popularity, and it dropped from 67.69% down to 54.74% by the end of the year.
Windows Vista was on the decline, dropping from 22.53% to 16.76% that year. Windows 7 was taking the Windows market by storm, and it overtook Windows Vista in August 2010.
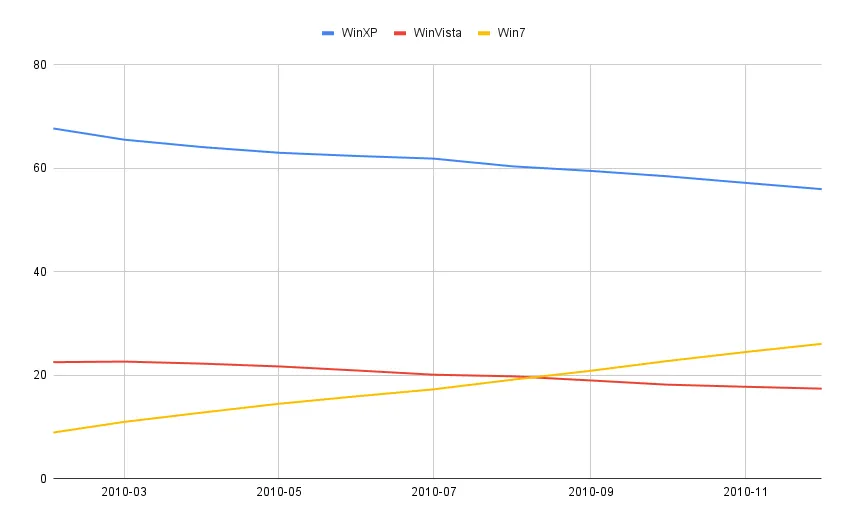
Although Windows 7 had only 8.93% at the beginning of the year, by the end it had 27.98%. Speaking of which, if you’re using Windows 7 in the current year, it’s a good idea to download all Windows 7 updates to keep your PC safe.
2011 – Windows 7 reigns supreme
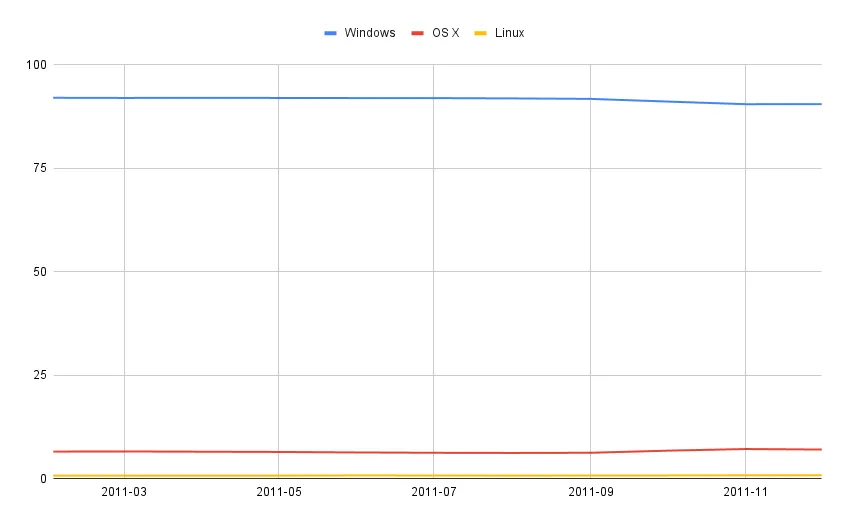
Windows was on a slow decline in 2011, and its market share dropped from 92.02% to 90.29%. On the other hand, macOS was still on the rise, from 6.56% to 7.01% by the end of the year.
As for Linux, it only had 0.83% by the end of the year.
When looking at the detailed information regarding Windows market share, Windows XP was still declining, dropping from 53.01% to 40.35% by the end of the year.
Windows 7 was on the rise, and it overtook Windows XP as the most used Windows operating system by October. It rose from 30.08% to 47.23%.
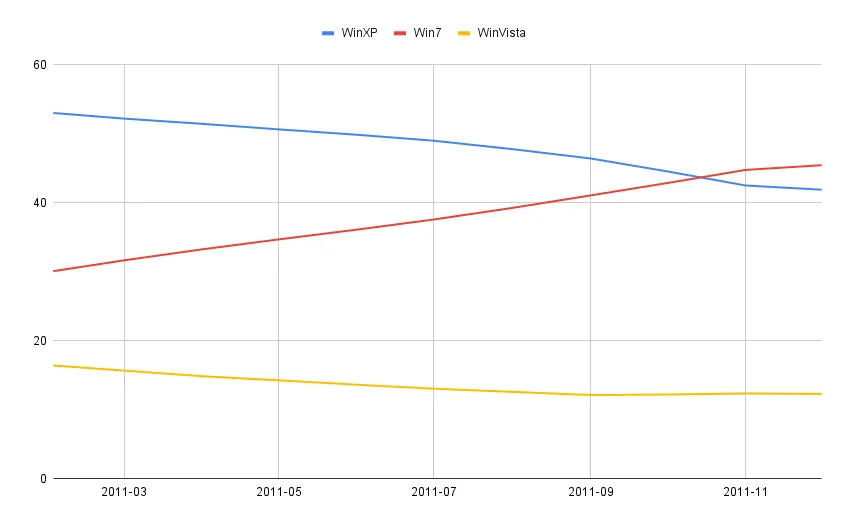
As for Vista, it was on a decline, and it went down from 16.41% to 12.05% by the end of the year.
2012 – Windows market share is on the rise
In 2012 Windows’ market share rose from 89.62% to 91.22%. As for macOS, it had a few minor ups and downs, but by the end of the year, it had 7.69%.
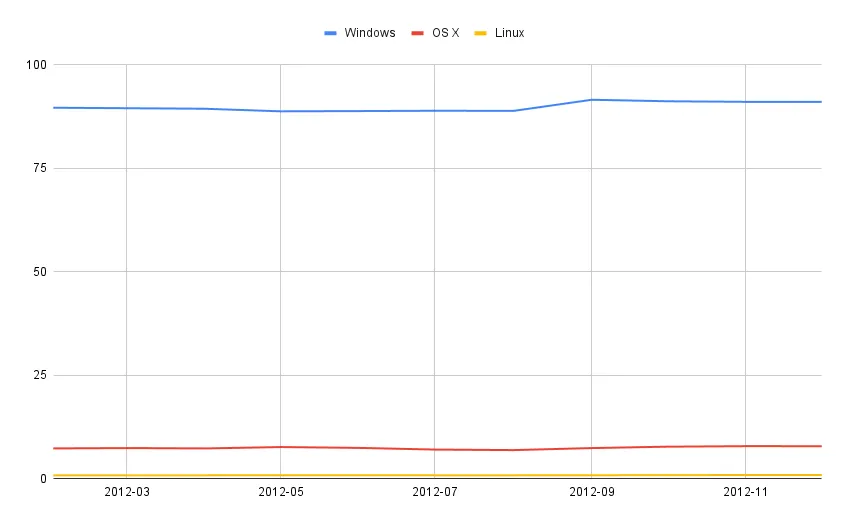
As for Linux, it had only 0.88% and a negligible increase in market share.
On the Windows market, Windows 7 was dominating, and it jumped from 49.17% to 60.89% by the end of the year.
Windows XP was losing users, and it went down from 38.8% to 29.12% that year. Windows Vista also saw a decline from 11.66% to 7.73% that year.

2013 – Windows 8.1 is released
Windows was declining in 2013, and its market share went down from 90.96% to 89.55%. During this time, macOS also experienced a minor decline from 7.95% to 7.83%.

Linux also saw growth during this year, and by the end, it had 1.13% of the market. This year a new contender appeared in Chrome OS, but it didn’t achieve any noticeable success.
On the Windows market, Windows 7 was still dominating, and it had a small increase in market share from 61.16% to 61.19%.
Windows XP was still on the decline, and it went from 28.05% to 22.1%. Vista had a similar fate and it went down from 7.61% to 4.8%.
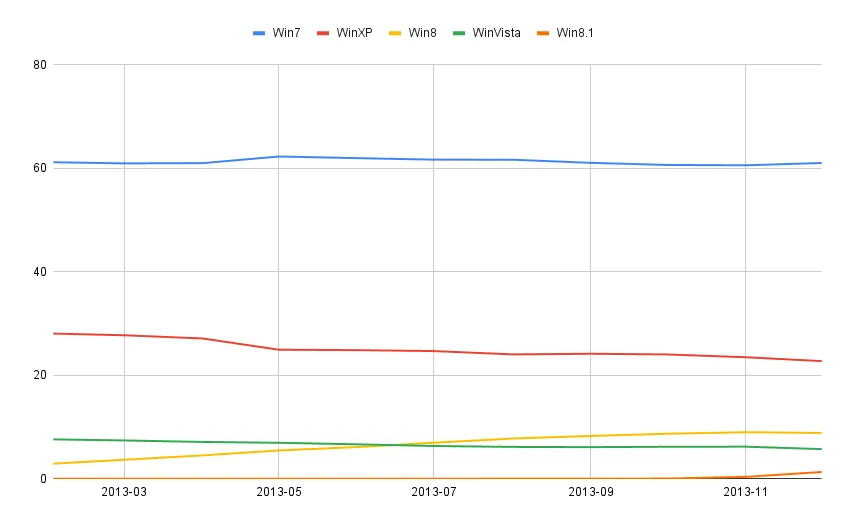
Windows 8 didn’t turn out to be a success, but it had growth from 2.92% to 9.08%. It seems that Microsoft wasn’t pleased with the results, so they released a Windows 8.1 update that year. By the end of the year, Windows 8.1 had a 2.48% market share.
2014 – Windows 8.1 is on the rise
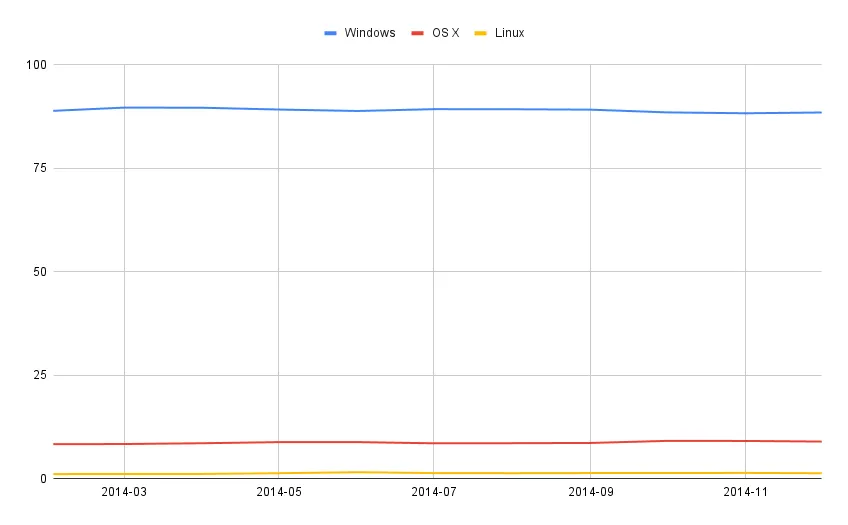
In 2014 Windows platform experienced ups and downs, and it went from 88.87% to 88.74% by the end of the year.
macOS had a similar fate, and it went from 8.35% to 8.67% that year. Linux, on the other hand, saw a rise in market share and it had 1.39% by the end of the year.
Regarding the Windows market, Windows 7 saw a minor jump from 61.17% to 61.31% that year. Windows XP was on the decline, and it went down from 21.53% to 14.88%.
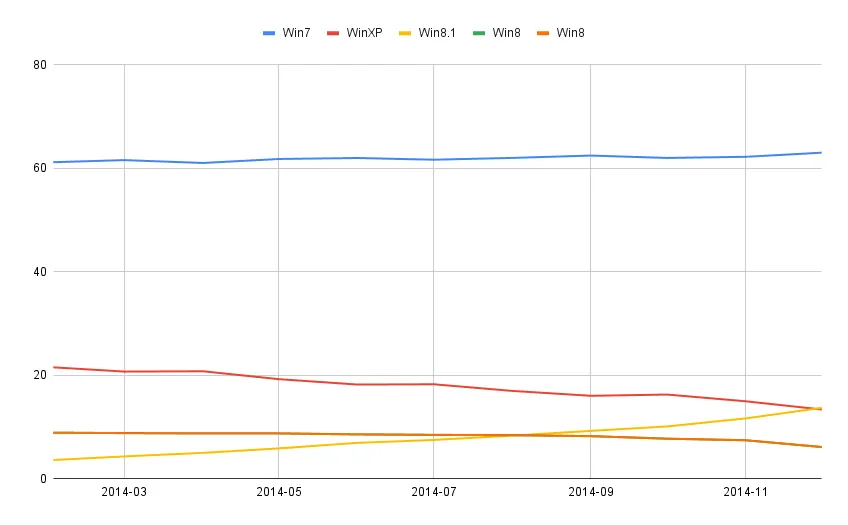
Windows 8 was on the decline as well, and in August Windows 8.1 overtook it. By the end of the year, Windows 8.1 jumped from 3.62% to 14.69%, and it was close to overtaking Windows XP for the first time.
2015 – Windows 10 dominates the market
2015 brought another drop in market share for Windows, and it went down from 88.19% to 84.89%. As for macOS its market share went up from 9.1% to 9.8% that year. MacOS achieved a record 10.51% in May of that year.
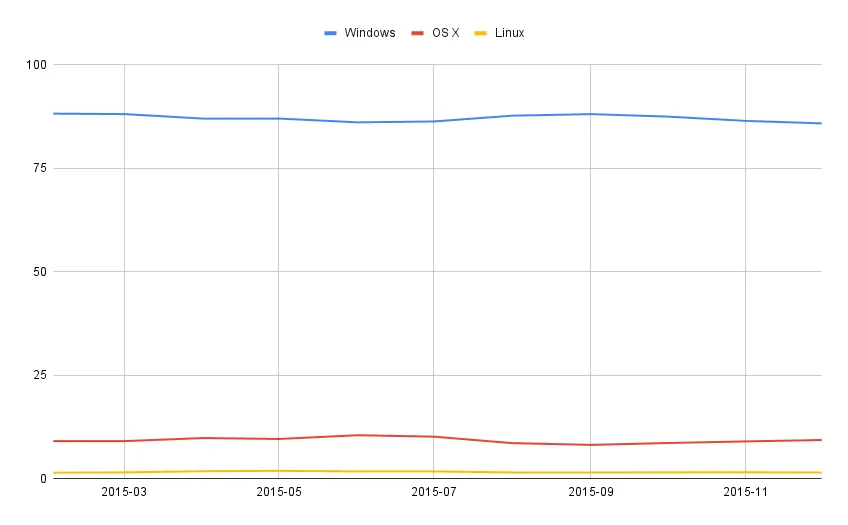
Linux had 1.48% by the end of the year, while Chrome OS still had an almost non-existent market share.
2015 was an exciting year for Microsoft operating systems, and Windows 7 was on the decline for the first time, going from 61.99% to 55.89%.
Windows XP was also on the decline dropping from 13.59% to 9.95%. Windows 8.1 had a slow growth until July but in the end, it dropped from 16.19% to 14.31%.
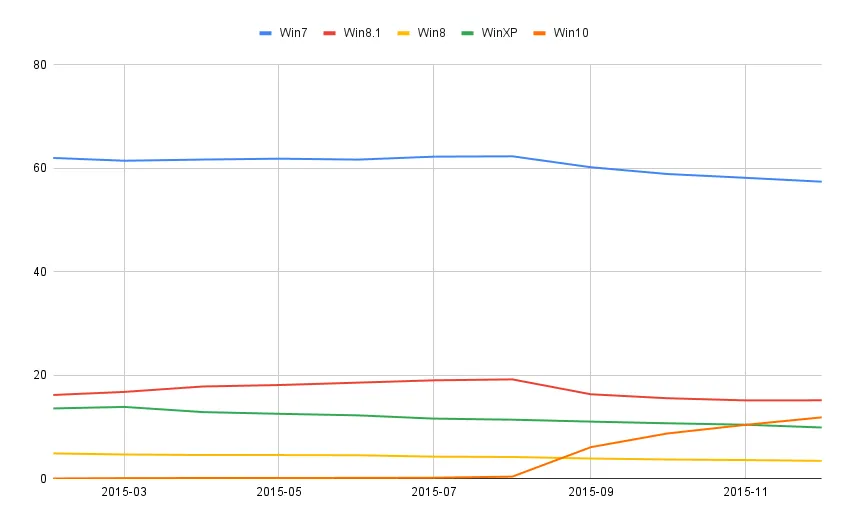
Windows 10 was released that year, and it took the Windows market by storm taking 13.98% of the market in just a few months after its release.
2016 – macOS sets a new record
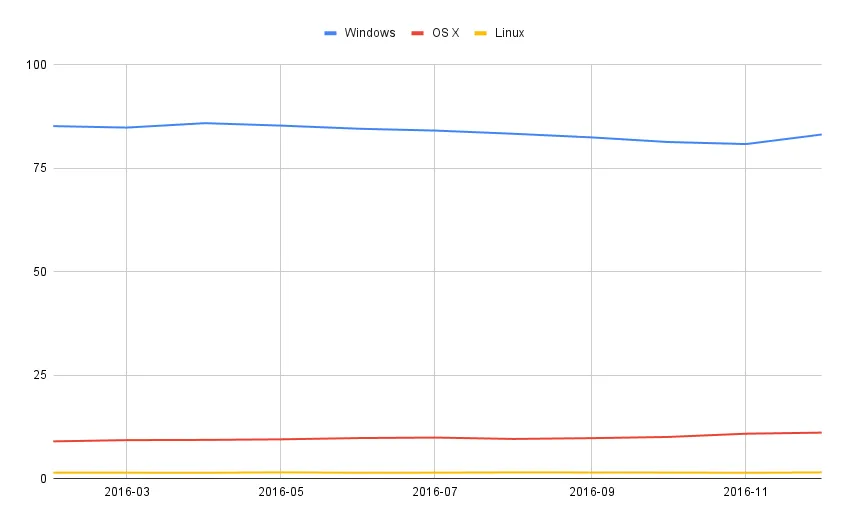
2016 wasn’t a good year for Windows, and its market share dropped to 80.84% in October, but it recovered quickly. However, it dropped from 85.18% to 84.27% that year.
macOS was growing strong that year, and it went from 9.03% to 11% setting a new record. That year Linux had 1.57% while Chrome OS was still under 1%.
Windows 7 was still losing userbase, and it went from 54.78% to 47.74% that year. Windows 10 was on the rise and it jumped from 16.02% to 32.22%, doubling its market share.
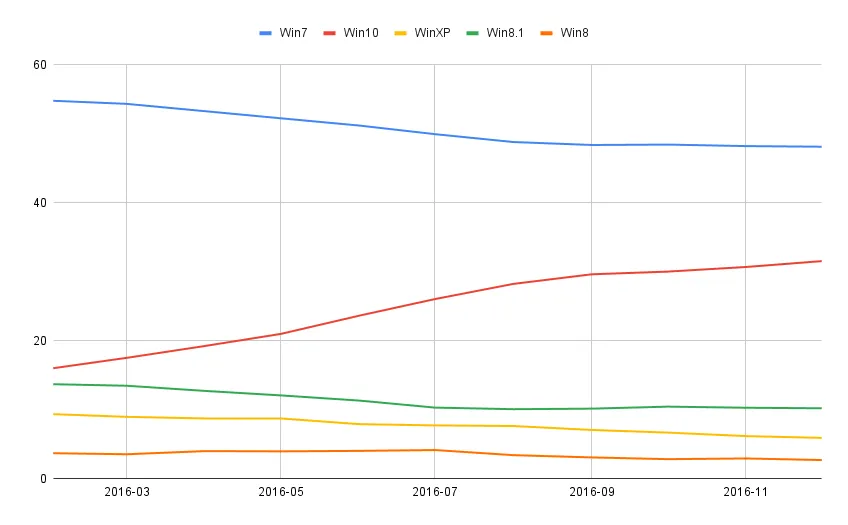
Windows 8.1 and XP were declining, and the former went from 13.7% to 10%. Regarding XP it went from 9.36% to 5.93%.
2017 – Windows 10 to overtake Windows 7
Windows market share declined in 2017 yet again from 84.4% to 82.68%. Apple set a new record with macOS, and it went from 11.2% to 13.06%. Linux had 1.54%, and Chrome OS had slightly less than 1%.
Speaking of Linux, if you never tried it, you might want to consider using one of these Linux emulators for Windows.
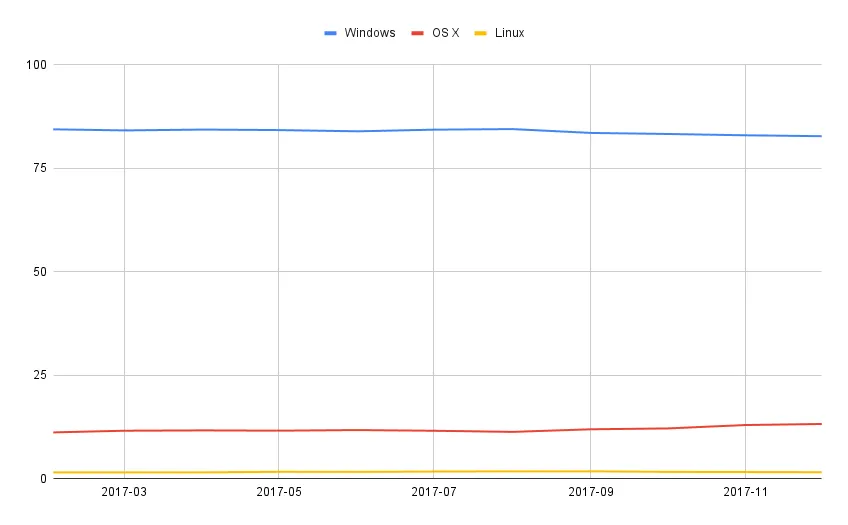
On the Windows market, Windows 7 was declining from 47.46% to 41.89%. Windows 10 was on a path to overtake it, and it went from 32.84% to 41.69%.

Windows 8.1 was on a slow decline, from 9.65% to 9.16%, and Windows XP had about 3.6% by the end of the year.
2018 – Major drop in Windows market share
For Windows, 2018 was a particularly harsh year, and its market share went down from 82.68% to 76.17%. The operating system reached a record low with a 70.22% market share in November, but it has recovered quickly.
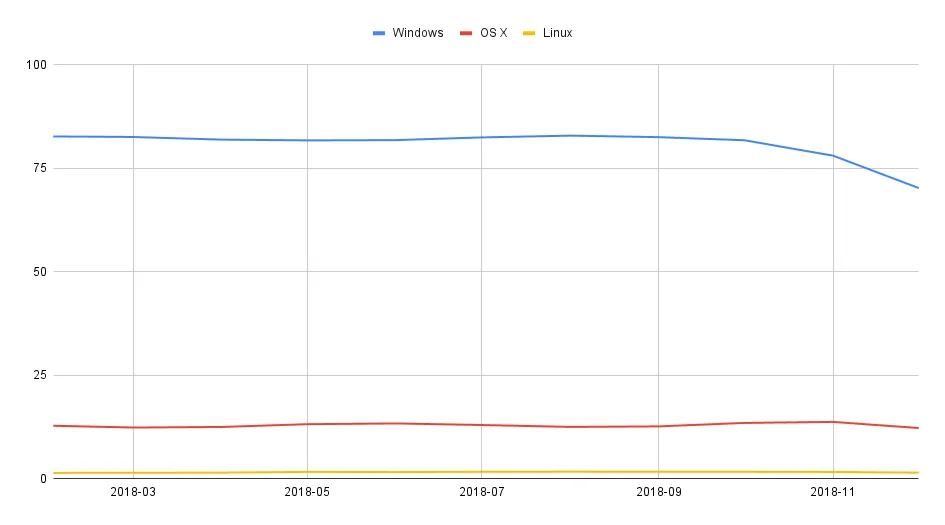
At the same time, macOS experienced a drop as well and it went from 12.8% to 12.33%. That year, Linux had 1.69% while Chrome OS went from 0.9% to 1.35% and set a new record.
Regarding Windows, Windows 10 set itself as a dominant operating system and it went from 42.78% to 52.36%.
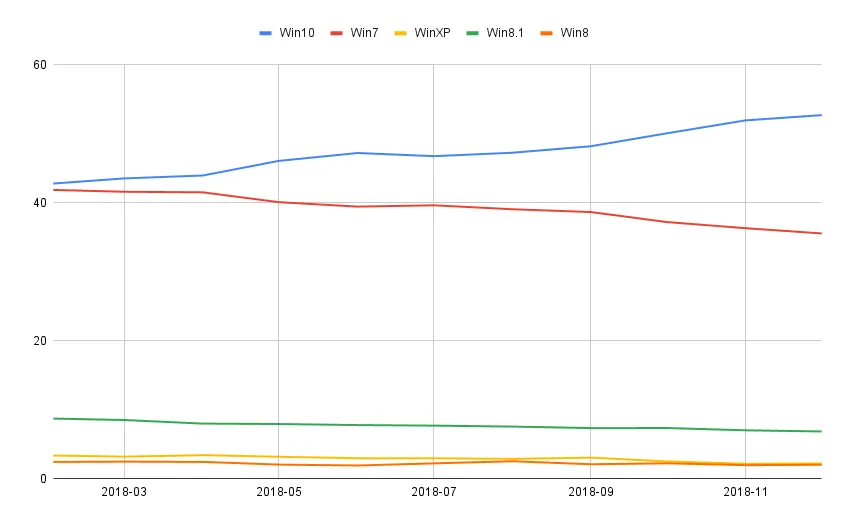
Windows 7 was declining from 41.86% to 35.63% that year. Windows 8.1 was also losing users, and it went from 8.72% to 6.95%.
2019 – macOS is on the rise
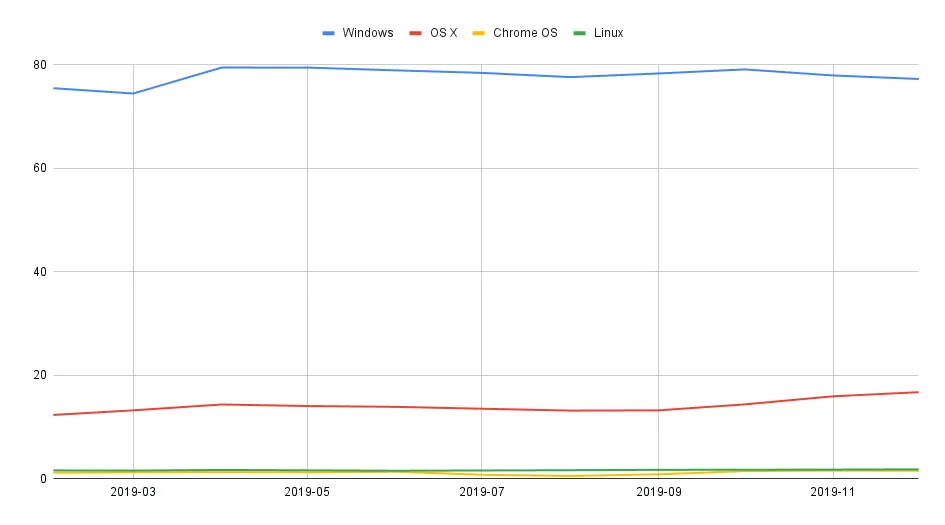
In 2019, Windows recovered from a previous drop, and it’s one year in which Windows market share grew. As for the exact numbers, the share went up from 75.47% to 77.65%.
macOS set another record going from 12.33% to 16.46%. As for Linux, it went up to 1.85%. Chrome OS saw a rise from 1.17% to 1.45%, after achieving a new peak in October of that year.
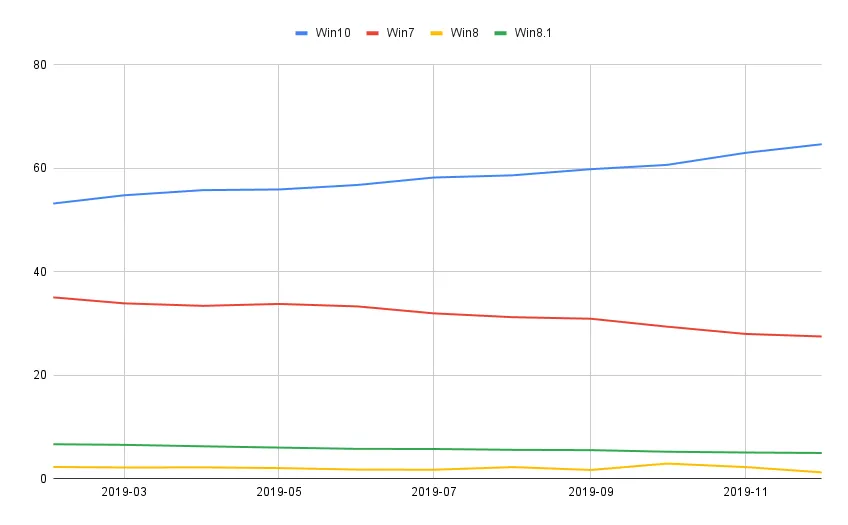
As for Microsoft operating systems, Windows 10 was on the rise from 53.18% to 65.4% while Windows 7 was on the decline. That year Windows 7 dropped from 35.05% to 26.79%. Regarding Windows 8.1, that year it finally went under 5%.
2020 – Windows 10 reigns supreme
Windows platform saw another decline in 2020, and its market share went down from 77.7% to 76.56%. Apple saw a minor increase from 17.04% to 17.1%. Keep in mind that during this period Apple reached its peak in April at 18.99%.
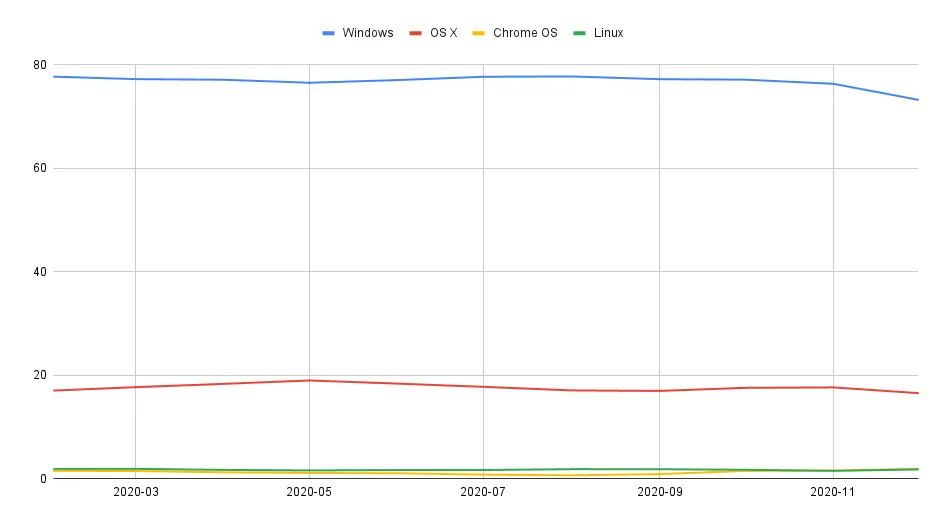
Linux had 1.93% that year while Chrome OS jumped from 1.52% to 1.72%.
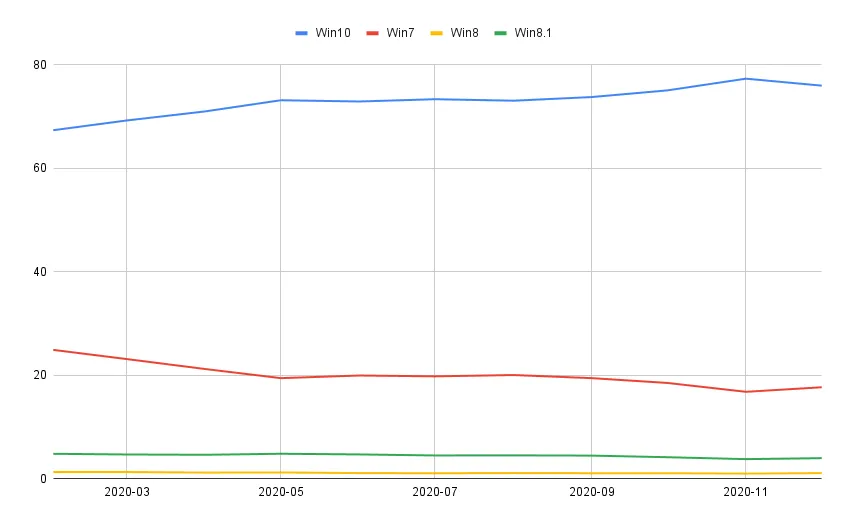
Windows 10 was dominating the Windows market, and it got from 67.35% to 75.68% in a year. All other versions were on the decline and Windows 7 went from 24.9% to 18.03%.
2021 – Slight drop for Windows and macOS
2021 wasn’t a good year for most companies, and Windows got a drop from 76.26% to 73.72%. Apple followed the same trend, and macOS dropped from 16.91% to 15.33%.
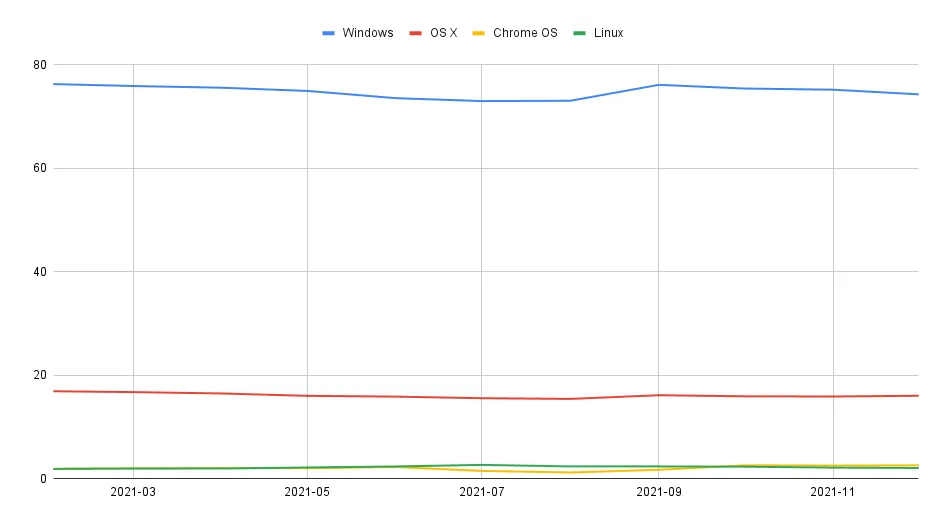
During this time, Linux got to record 2.09% market share while Chrome OS went from 1.91% to 2.18%.
As for the Windows platform, Windows 10 rose from 77.47% to 82.49%. Windows 7 continued its decline from 16.81% to 12.91%.

2022 – Windows 11 is on the rise
In 2022 Windows recovered from the previous year and went from 75.5% to 75.34% which is a negligible drop.
As for macOS, it went from 15.85% down to 14.66%. That year, Linux was on the rise, reaching 2.93% of the market share.
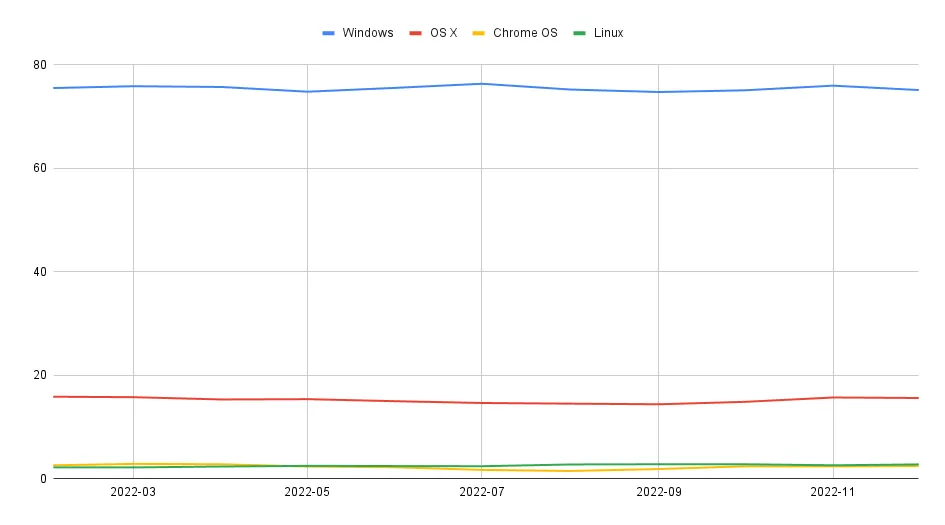
And lastly, Chrome OS went from 2.6% to 2.28%, which is a first-time drop for the system.
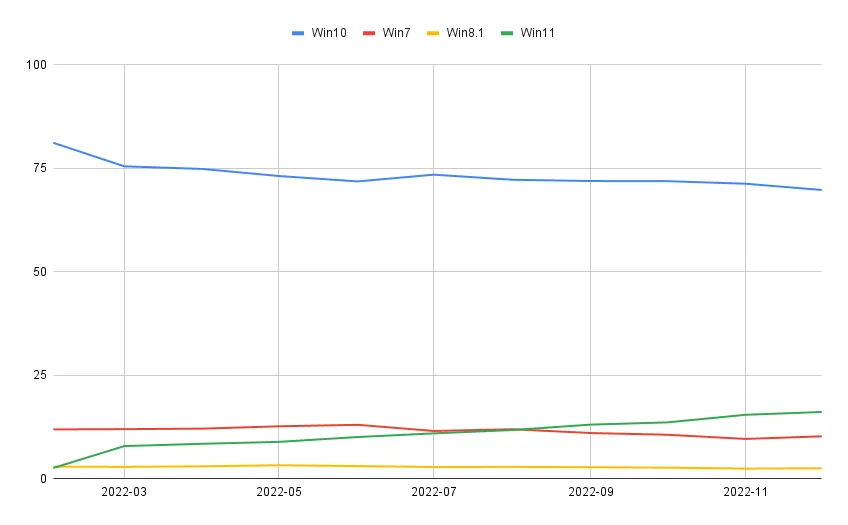
2023 – Windows is still on the decline
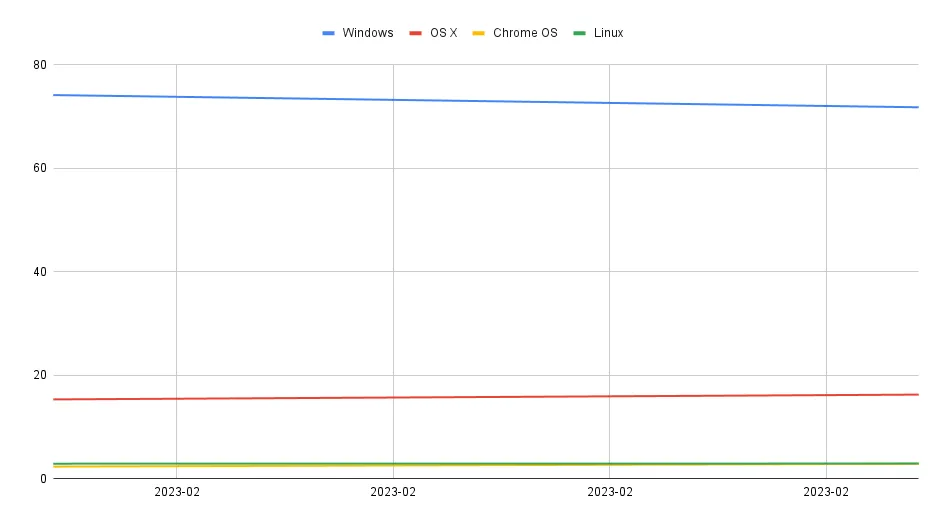
Windows was again declining in 2023, and by March it dropped from 74.14% to 69.4%. macOS saw a steady rise, and it went from 15.33% to 17.21%.
Regarding Linux, it is down from 2.91 % to 2.85% for the first time. Chrome OS was on the rise, and it went from 2.25% to 3.23% until March.
In 2023, Windows 10 is still the dominating OS, with 73.46% of the market share. Next up is Windows 11 with 20.95%. Lastly, there’s Windows 7 with 3.73%.

This is info until March, and we’re excited to see how the market share will change in the upcoming months.
Mobile market share
2009 – iOS challenges SymbianOS
In 2009, SymbianOS was a leading mobile operating system, but its market share begin to drop and in that year it went from 39.31% to 35.05%.
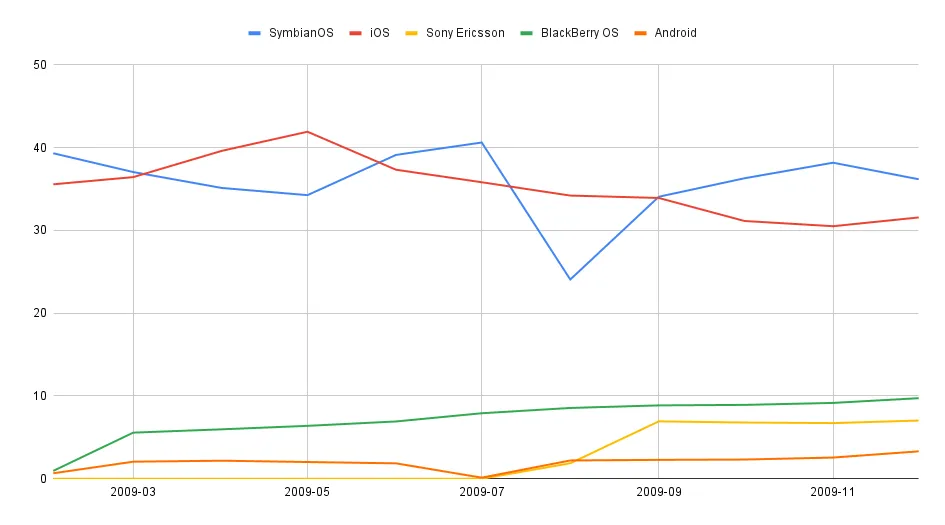
iOS was on the rise, however, its market share went from 35.56% to 32.05%. BlackBerry OS went from 0.95% to 9.69% that year alone. Android was also new, and it went from 0.66% to 4.07%.
2010 – Major drop in iOS
In 2010 SymbianOS was still the leading operating system. As for its market share, it went from 34.16% to 29.66%.
Next, there was an iOS that encountered a surprising drop from 33.13% to 23.57%. BlackBerry OS was also getting a bigger share of the market, and it went from 10.28% to 18.04%

2011 – Android surpasses iOS
In 2011 we saw a surprising increase in Symbian OS and its market share went from 30.25% to 33.46%. iOS suffered a decline, and it went from 25.02% to 22.71%. Android was on the rise and it was on its way to surpass iOS.

As for its market share, it went from 14.61% to 21.83%. And lastly, BlackBerry OS declined from 15.03% to 7.78%.
2012 – The end of Symbian OS
The year 2012 saw the massive decline of Symbian OS, and during a single year, its market share dropped from 31.89% to 10.72%.
Android was rising, surpassing Symbian OS as the leading mobile OS. It went from 23.21% to 33.19%. iOS had a small decline, and it went down from 24.04% to 23.26%.
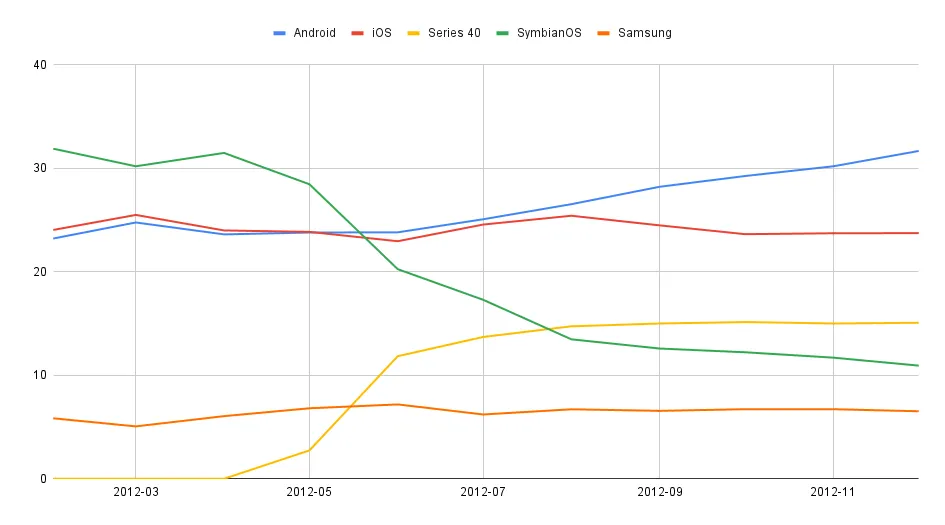
There was also a new competitor in the form of Series 40, and it went from 0% to 14.86% in less than a year.
2013 – Android dominates the mobile market
In 2013 Android continued to dominate the mobile market, and it went from 36.87% to 42.99%. iOS was on the decline, and it went from 25.85% to 21.82%.

Series 40 also had a small jump from 12.86% to 13.02%. Other mobile operating systems had less than 5% each.
2014 – Android takes more than half of the market
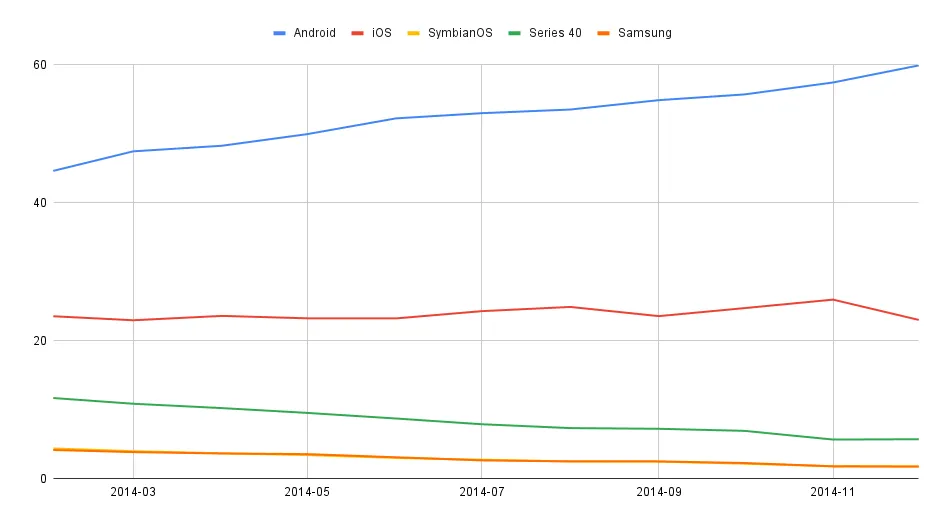
iOS saw some ups and downs and in the end, its market share dropped from 23.55% to 23.51%. Series 40 was on its way out and its market share dropped from 11.7% to 5.76%. Other operating systems had less than 3% each.
2015 – Android on the rise
The same trends occurred in 2015, and Android continued to dominate the worldwide market. Its share went from 59.78% to 65.9% in a year.

2016 – Android dominates the market
2016 continued the trend from the previous year. Android went from 66.28% to 71.97%, and it was dominating the market.
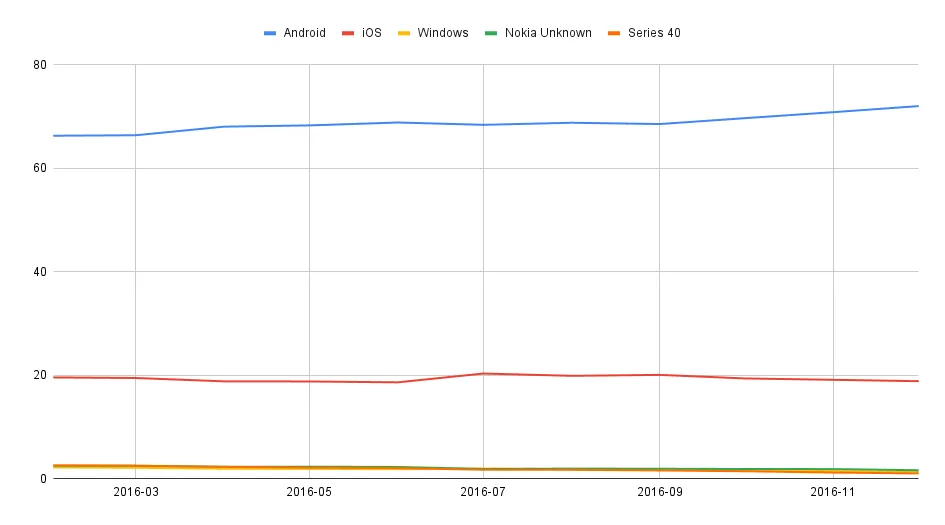
iOS had a minor decline, from 19.58% down to 18.89% on the global market.
2017 – Small rise for iOS
2017 was uneventful, and Android slightly jumped from 71.58% to 73.54%. iOS experienced some ups and downs, and it even reached 20.32% in August.
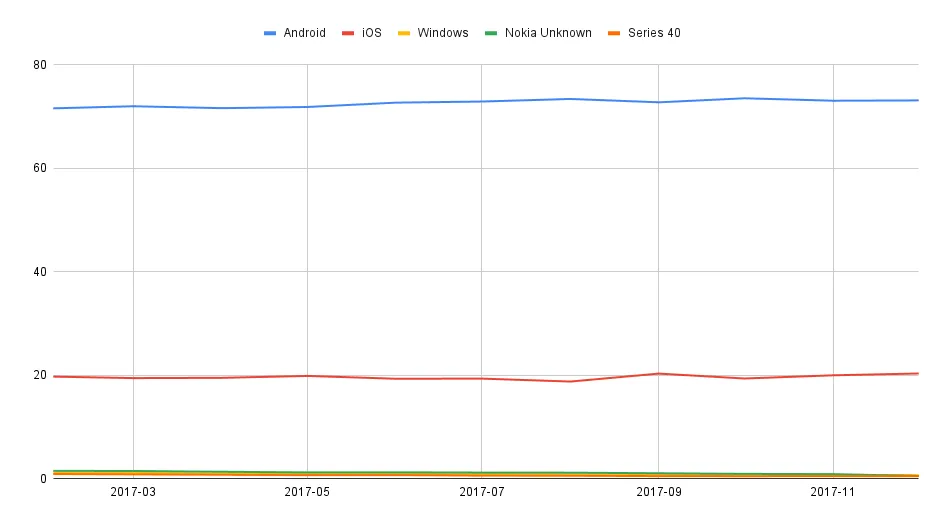
In the end, it just saw a minor increase from 19.73% to 19.91%.
2018 – Android takes 3/4 of the market
During 2018, Android continued its domination of the world market, and it went from 74.39% to 75.16% following a small drop in November.

iOS reached a new high point in November at 24.44%. Over the year, iOS share went from 19.64% to 21.98%. If you ever wanted to try iOS, there are many great iOS emulators for Windows.
2019 – iOS on the rise
This is the first year in which the Android market share declined. It went from 74.45% up to 76.67% and then it dropped to 74.13% by the end of the year.
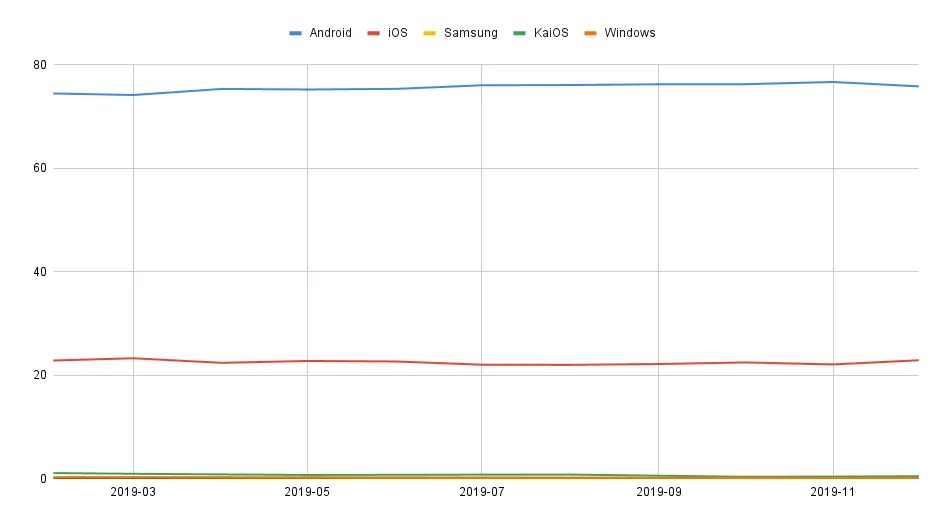
On the other hand, iOS saw an increase, and it went from 22.85% to 24.79%.
2020 – iOS takes 1/4 of the market
2020 was followed by another decline in the Android market share, going from 74.3% to 72.48%. iOS increased its market share that year and peaked in April at 28.79%.

Over the year, its market share went from 24.76% to 26.91%.
2021 – Android on slow decline
The slow decline of Android continued in 2021, and its market share dropped from 71.93% to 70.01%.
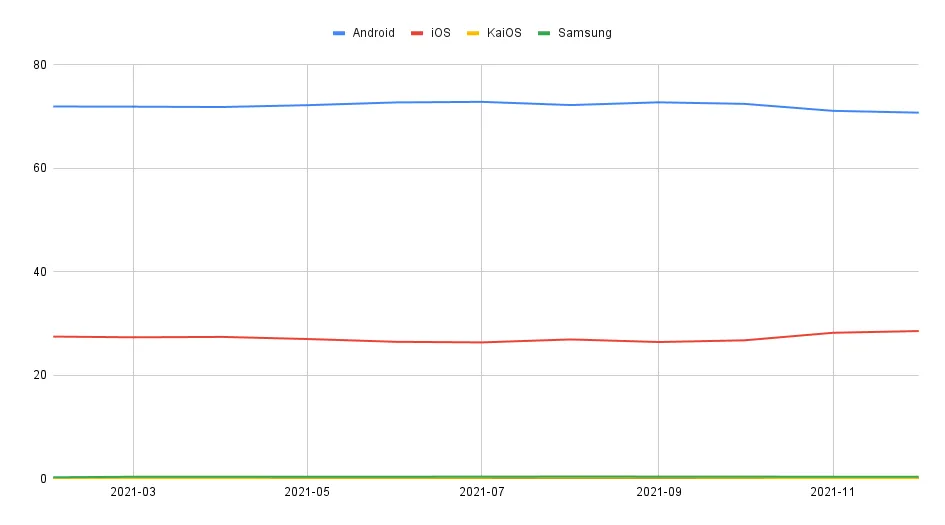
iOS was still on the rise, and its market share rose from 27.47% to 29.24%.
2022 – Android on the rise again
After several years, Android’s market share rose from 69.74% to 72.37%.
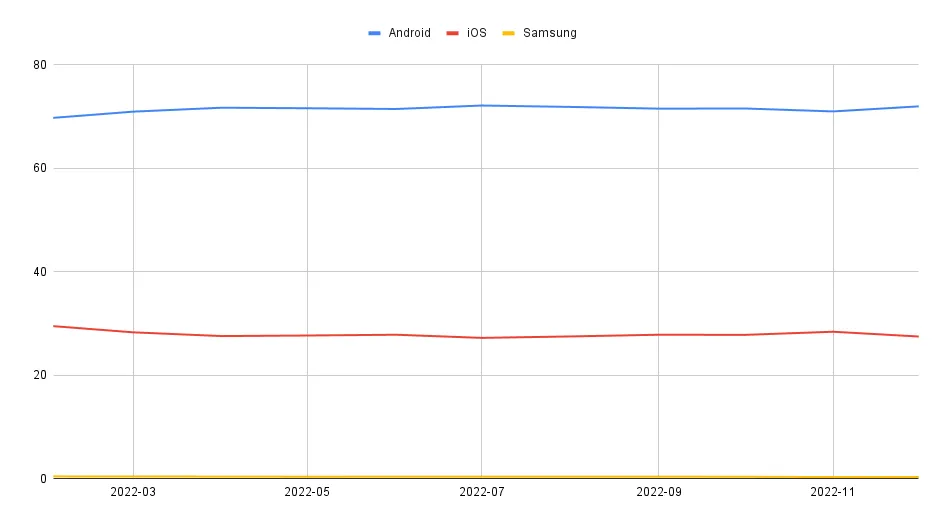
iOS was on the decline, and it went down from 29.49% to 26.98%.
2023 – Minor drop for Android
In 2023 Android is on the decline again, and it went from 71.77% to 70.88% in March.
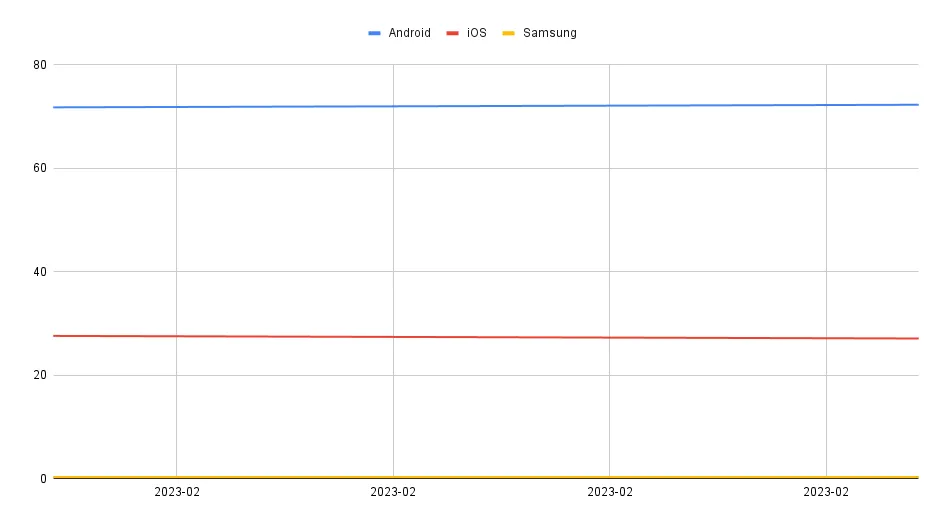
As for iOS, its numbers rose from 27.6% to 28.42% until March.
Tablet market share
2012 – Slow rise of Android
We start our analysis in 2012, and in August iOS was dominating the tablet market. Between August and the end of the year, iOS market share went from 85.61% to 79.71%.
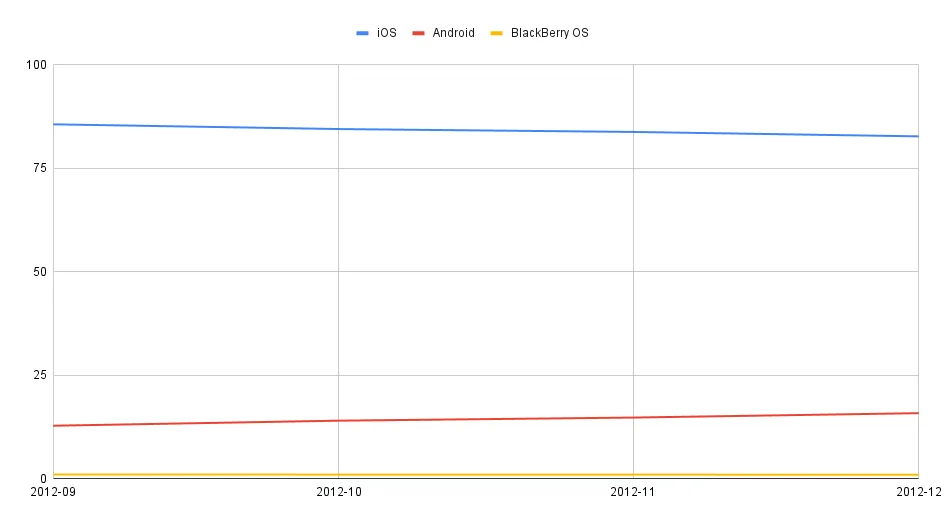
As for Android, in August had 12.81%, and it rose to 18.81% by the end of the year.
2013 – iOS now controls less than 3/4 of the market
In 2013 iOS was on the decline, and its market share dropped from 76.74% to 73.77%. Android market share was on the rise from 20.16% to 22.59%.

There was also a tablet version of Linux in 2013 and by the end of the year, it had 2.67% of the market.
2014 – Android now holds more than 1/4 of the market
The decline of iOS continued in 2014, and Apple went from 73.77% to 68.25%. On the other hand, Android was on the rise, and it went from 22.34% to 27.96%.
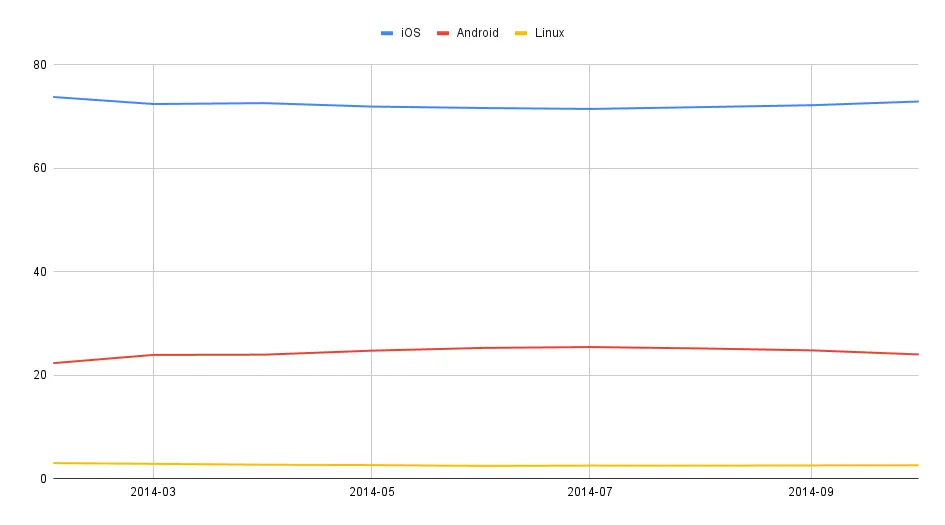
As for Linux, it was on the decline, and it went from 3.02% to 2.56% in 2014.
2015 – Android on the rise
iOS decreased its market share in 2015, and it went from 66.57% to 66.38% which is a negligible loss. As for the Android, it rose from 29.29% to 31.65%.
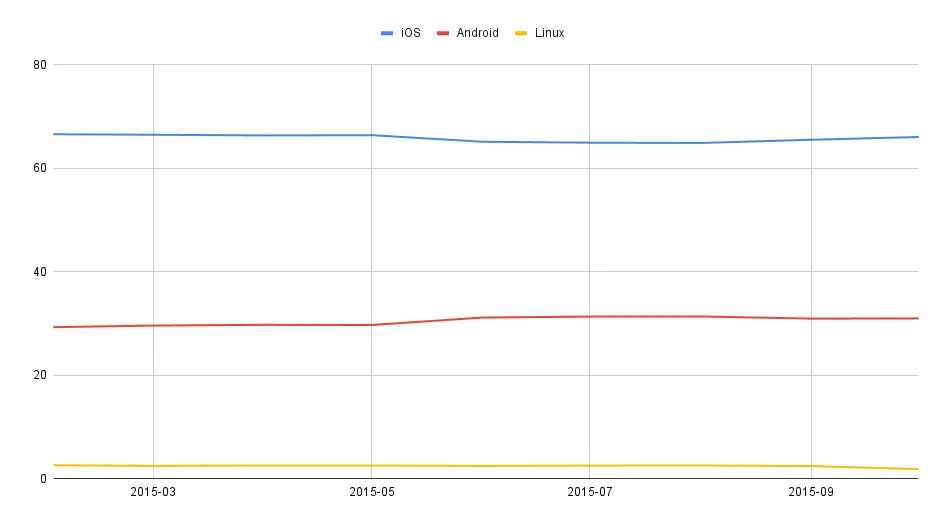
If you’re a fan of Linux, we’re sad to say that its market share dropped from 2.61% to below 1% during a single year. Linux didn’t achieve any major success in the tablet market, but if you love Linux, you can always install Linux on a Surface Pro tablet.
2016 – Android now holds a third of the market
Not a lot has changed in 2016 in the tablet market share. iOS was still the leading operating system but on a small decline from 66.48% to 65.81%.
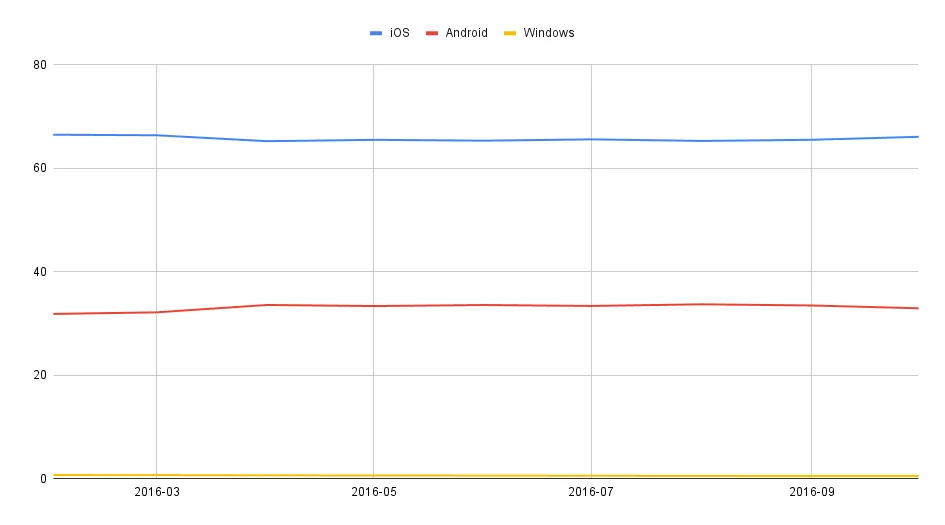
Android was on the rise and it went from 31.85% to 33.33% in a year. Windows also had a negligible presence on the tablet market, but in order to use it, you need to enable Tablet Mode on it.
2017 – Small rise for Android
The same trend continued in 2017, and iOS went from 66.15% to 64.46%. It’s worth mentioning that there was a small rise in November, with iOS reaching 66.9%.

As for its competitor, the downfall of iOS affected Android, and in July Android reached its peak at 35.07%. As for the entire year, it went from 33.11% to 34.06%.
2018 – iOS strikes back
2018 was an exciting year for the tablet market in which iOS increased its market share from 64.52% to 72.32%. It’s worth mentioning that in November of that year it had 74.62%.
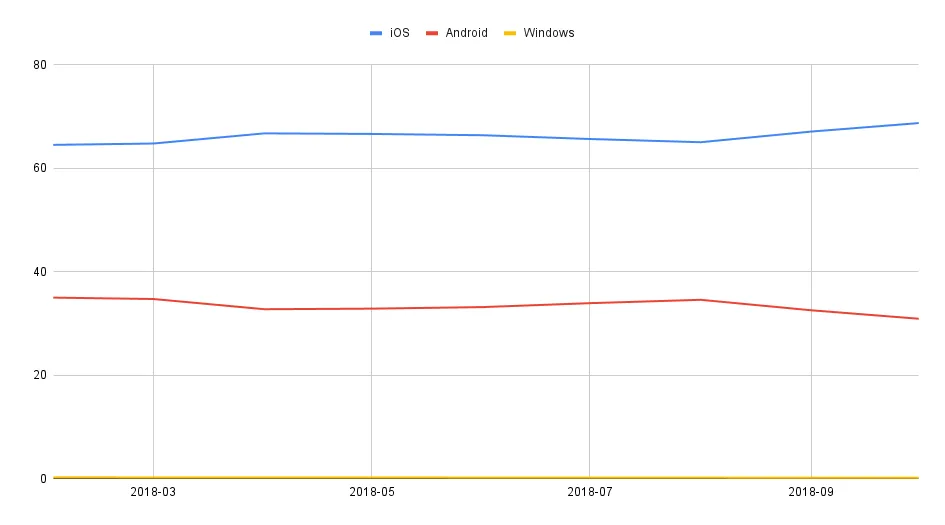
Regarding Android, the success of iOS directly affected it, and it fell from 35% to 27.34%. Android market share went as low as 25.01% in November of that year.
2019 – iOS market share drops by 10%
Another shift was seen in 2019, and after a minor market share increase the iOS market share begin to drop. During that year, it had a surprising drop from 73.37% down to 63.11%.
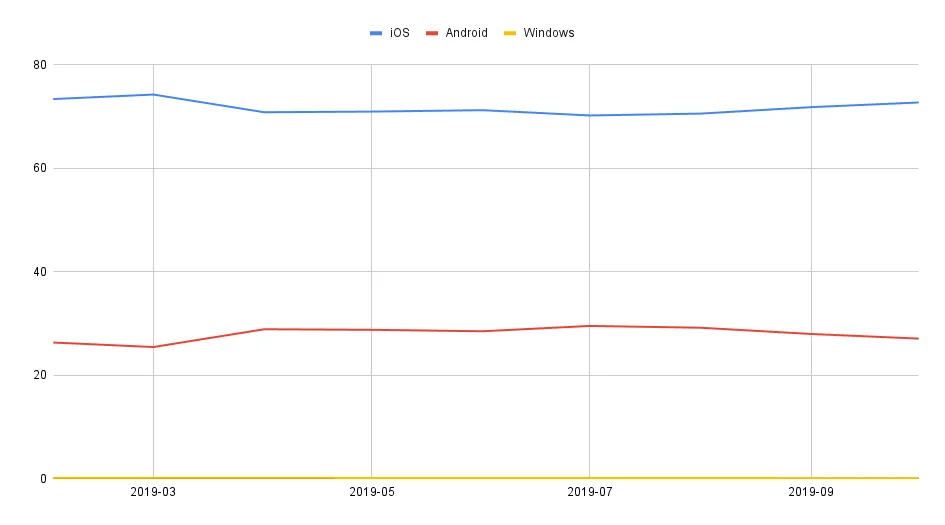
This was good news for Android, since all of that market share went to it, and its numbers went from 26.32% to 36.65% in a year.
2020 – iOS continues to lose market share
After the massive changes in 2019, 2020 wasn’t as exciting, but the same trends continued. iOS lost some of its market share, and it went from 60.63% to 56.62%.
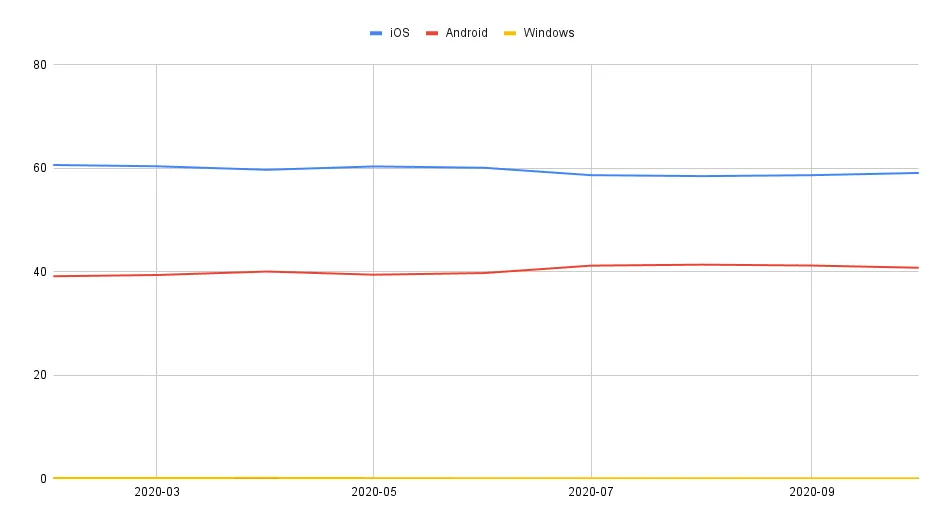
Like in the previous year, this positively affected Android, and its market share went up from 39.13% to 43.27%.
2021 – iOS holds its ground
2021 was uneventful; both platforms had minor ups and downs, directly mirroring one another. At the end of the year, the iOS market share shifted from 55.96% to 55.66%.

Regarding Android, its market share went up from 43.93% to 44.25%.
2022 – Android to overtake iOS?
In 2022, the market share was almost evenly split between the two platforms. Apple went from 54.73% down to 51.21%. It went low as 50.68% during October of that year.

On the Android side, there was a rise from 45.17% to 48.66%. Android achieved a peak that year in October with 49.19% of the market share.
2023 – iOS on the rise again?
2023 is set to be an exciting year, in the first quarter, it seems that Apple’s market share is on the rise. From January to March iOS market share went from 51.48% to 52.33%.

Regarding Android, it went from 48.38% down to 47.51%, and we can’t wait to see how the market will change by the end of the year.
Which OS has the largest market share?
Globally, the largest market share belongs to Android, and it currently has 38.89%, according to Statcounter’s worldwide statistics. As for desktop operating systems, Windows is still dominating, and it has 27.75%.
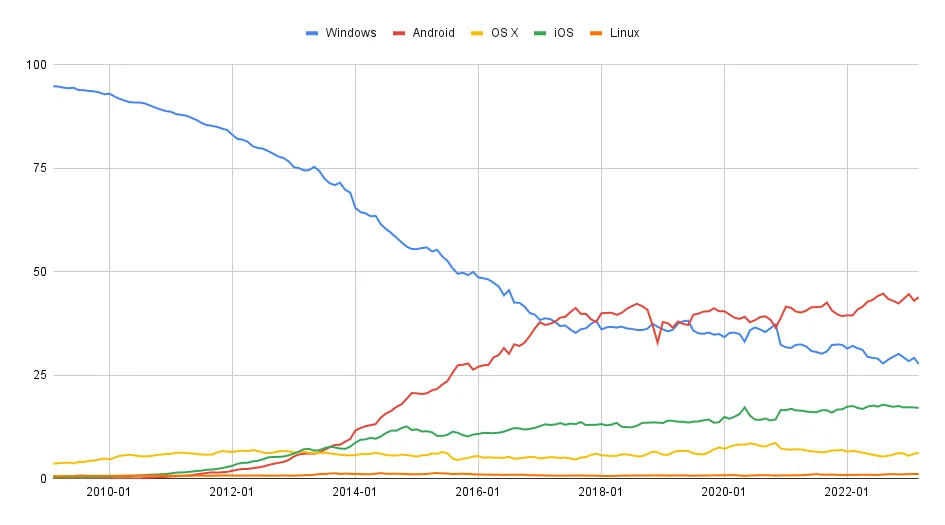
Interestingly, Android overtook Windows in April 2017, and it was a dominating operating system ever since. Seeing how many smartphones and Android devices are out there isn’t a surprise.
What is the most popular OS in US?
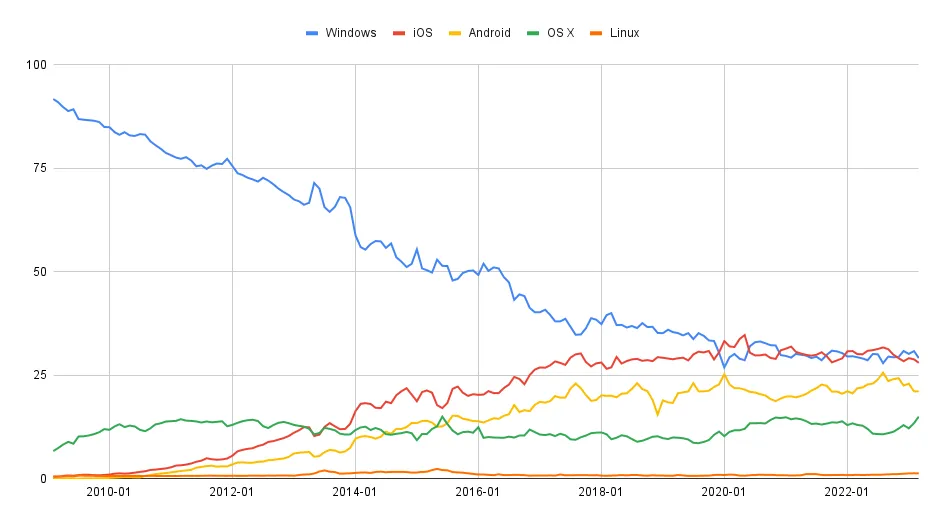
The most popular operating system in the US is Windows at 32.42% of the market, according to Statcounter’s operating system stats for the US. As for the mobile market, it’s iOS with 23.41%.
What are the 3 main OS in the market?
In the US, the top 3 operating systems are:
- Windows – 30.48%
- iOS – 25.81%
- Android – 19.63%
As for the global market, the top 3 operating systems are the following:
- Android – 41.48%
- Windows – 28.32%
- iOS – 17.31%
What is the market share of Mac vs Windows?
On the worldwide scale, Windows has 69.4%, and it’s on a slow decline. On the other hand, macOS has 17.21%, and it has been on the rise for years.
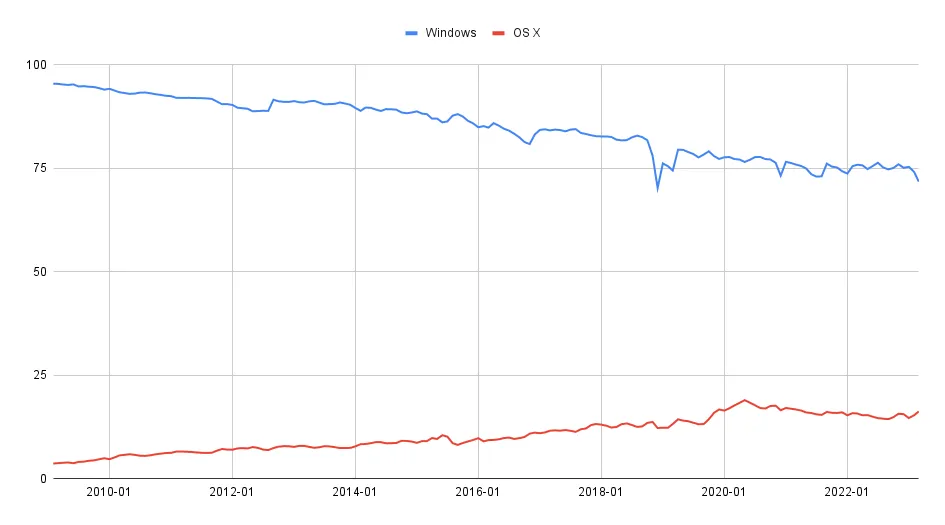
In the US, the situation is a bit different, and while Windows has 56.02%, it has been on a decline for months now. To learn more, we suggest reading our decline of Windows article for detailed analysis.
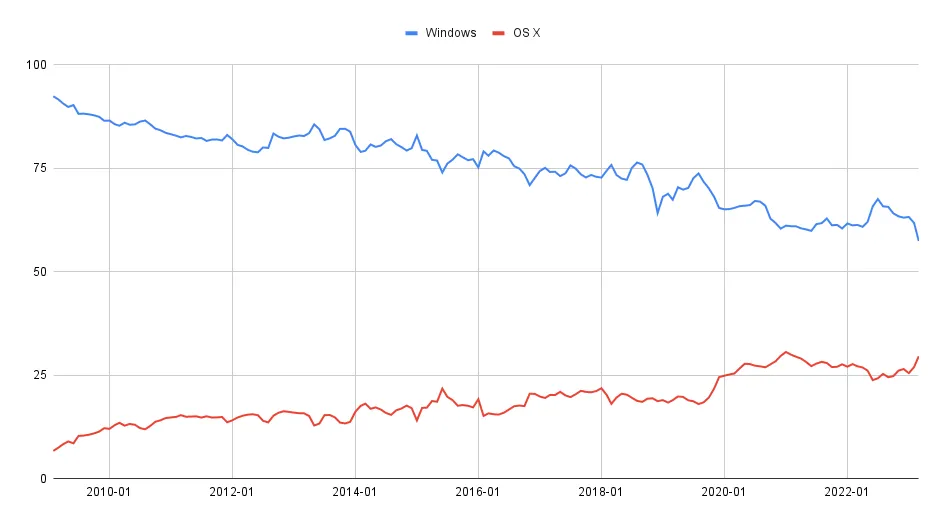
Regarding macOS, its market share is constantly rising in the US, and now it’s 30.41%. To learn more, we suggest reading our Windows 11 vs macOS and learning more about the differences between the two.
If you want to try both, there’s a way to dual boot Windows 11 and macOS on a single PC.
We hope that this guide has answered all of your questions that you had regarding the operating system market share.
As you can see, Android is the dominant operating system in the world, which isn’t a surprise, but for desktop computers, Windows is still the most used operating system.
What operating system do you use and why? Let us know in the comments below.
Leave a Reply