How to Use the Chrome Task Manager on Windows and macOS

If you’ve ever experienced Chrome bogging down your system or wondered what’s using up all your resources, you’ll be happy to learn that Chrome has a built-in Task Manager on both Windows and macOS. This powerful tool offers insight into running processes, memory, CPU, and network usage, helping you troubleshoot various issues. Learn how to open this secondary Task Manager, interpret the data, and use it to diagnose problematic sites, malicious sites, plugins, and more in this tutorial.
How to Open the Chrome Task Manager
As you might expect, the only way to open Chrome Task Manager is via Chrome itself. Assuming that you have the browser installed on Windows or macOS, follow these steps to open it regardless of the OS you’re using.
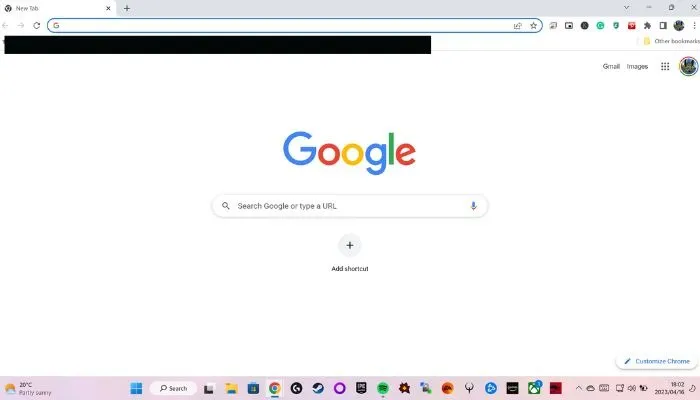
- Open the Chrome browser.

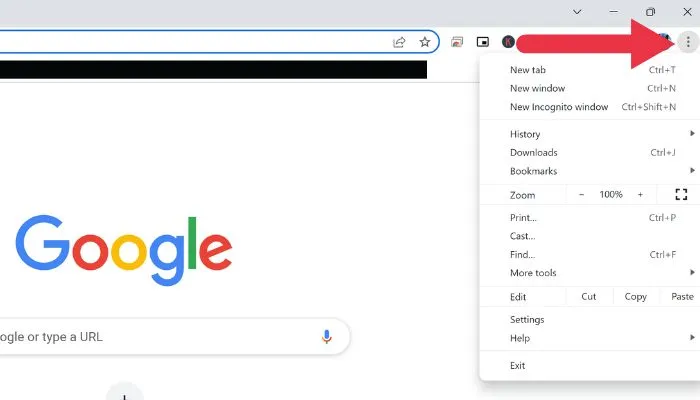
- Click on the three vertical dots in the top-right corner of the browser window to open the Chrome menu.

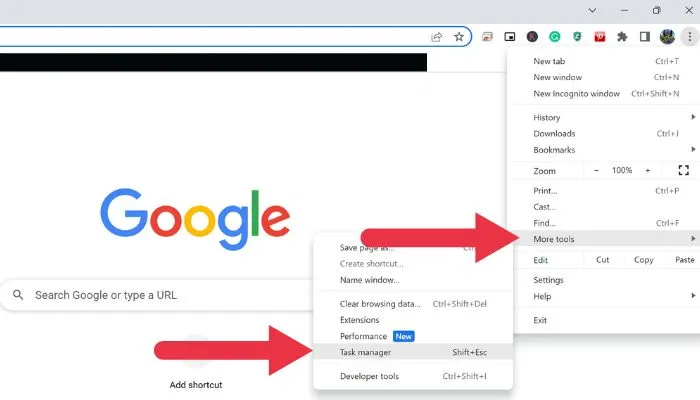
- Hover over “More tools,” then click on “Task manager.”

- Alternatively, use the keyboard shortcut Shift + Esc in Windows to open the Task Manager directly.
Understanding Chrome Task Manager
When it comes to managing your browser’s performance, knowledge is power. Understanding Chrome’s Task Manager unlocks a wealth of information about the processes running within Chrome, including tabs, extensions, and background tasks.
By delving into the intricacies of these processes, you can better monitor and optimize your browser’s resource allocation, leading to a smoother and more efficient browsing experience. It also has great value as a troubleshooting tool!
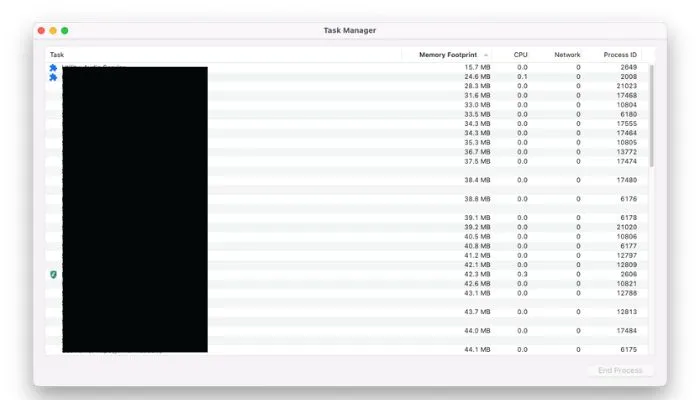
Upon opening Chrome’s Task Manager, you’ll be presented with a comprehensive list of active processes running in Chrome.

These processes encompass individual tabs, extensions, and background processes that may impact your system’s performance. For each process, the Task Manager provides valuable information, including:
- Task: the name or description of the process.
- Memory footprint: the amount of RAM the process uses, giving insight into its impact on system resources.
- CPU: the percentage of your computer’s CPU resources being consumed by the process, which helps identify performance bottlenecks.
- Network: the amount of network bandwidth being used by the process, allowing you to gauge its impact on your Internet connection.
- Process ID: a unique identifier assigned to each process, which is useful for advanced troubleshooting and diagnostics.
To further customize your view and streamline your analysis, click on the column headers to sort the data. For instance, clicking on “Memory footprint” will organize the processes based on memory usage, making it effortless to pinpoint which process is the most resource-intensive. By understanding how to interpret this data, you’ll be well-equipped to manage your browser’s performance and address any issues proactively.
Using Chrome Task Manager to Troubleshoot Chrome Problems
The Chrome Task Manager is useful for a number of troubleshooting purposes:
- Identify problematic sites: if Chrome is slow or unresponsive, open the Task Manager and look for any tabs consuming a large amount of memory or CPU resources. These could be the culprits behind the slowdown. Try closing the problematic tabs and check whether the performance improves.
- Detect malicious sites: some malicious sites use your system resources to mine cryptocurrencies or perform other nefarious activities. Seeing a site consuming a suspicious amount of CPU or network resources could indicate a malicious site. Close the tab and consider running a security scan on your computer.
- Troubleshoot extensions: extensions can also cause performance issues in Chrome. To identify problematic extensions, look for processes with high memory or CPU usage in the Task Manager. Disable or remove the problematic extensions and restart Chrome to see whether the issue has been resolved.
- Manage background processes: some processes continue running in the background, even when Chrome is closed. To identify these processes, look for items marked as “Background Page” in the Task Manager. If a background process consumes too many resources, consider disabling the associated extension or changing its settings.
- Monitor tab resource usage over time: keep an eye on the resource usage of tabs you visit frequently or keep open for extended periods. If you notice that resource usage increases significantly over time, it could indicate a memory leak or inefficient code on the website. Try refreshing the tab or contacting the site owner to report the issue.
- Check for browser compatibility issues: some websites might not be optimized for Chrome, leading to increased resource consumption. Compare the performance of the website in other browsers using their respective Task Managers or performance tools. If the site performs better in another browser, consider using that browser for that specific site.
Frequently Asked Questions
Does Chrome’s Task Manager show GPU usage?
Chrome’s Task Manager does not display GPU usage by default. However, you can enable this information by right-clicking on the column headers and selecting “GPU Memory” from the context menu. This will add a new column displaying GPU memory usage for each process. It can be a good way to know whether any performance issues are being caused by your computer running out of VRAM.
How do I end a process in Chrome’s Task Manager?
To end a process in Chrome’s Task Manager, click on the process to select it, then click on the “End Process” button in the lower-right corner of the Task Manager window. Be cautious when ending processes, as this may cause data loss or crashes in the associated tabs or extensions.
Is there a way to save or export the data from Chrome’s Task Manager?
Chrome’s Task Manager does not have a built-in option for exporting or saving data. However, you can take a screenshot of the Task Manager window or manually copy the information to another application, such as a spreadsheet or a text document.
Can I use Chrome’s Task Manager to monitor the performance of individual websites?
Chrome’s Task Manager provides data on memory, CPU, and network usage for each open tab, which can give you a general idea of a website’s performance. However, for more detailed performance monitoring, consider using browser developer tools, such as Chrome’s built-in DevTools, to analyze website performance and identify optimization opportunities.
Image credit: Unsplash. All screenshots by Sydney Butler.
- Tweet
Leave a Reply