How to make a Table in Illustrator
Table graphs are great ways to store and display data, but who would have thought that Illustrator could be used to make table graphs? Illustrator is a versatile vector graphic software from Adobe. Learning how to create a table chart or graph in Illustrator is quite easy to do.
Table graphs are simple yet effective ways to store data. Making table graphs in Illustrator ensures that the data will be scalable since Illustrator would make the table graph vector. Table graphs can be used along with other graphs like a 3D Bar Graph, to store and display data.
How to make a Table in Illustrator
This article will take you through the simple steps to create an attractive table graph or chart using Illustrator.
- Open and prepare Illustrator
- Select the Rectangular grid tool
- Click on the artboard to create the table
- Add color to the table
- Add data to the table
- Adjust table rows and columns if needed
- Group table and data
- Save
1] Open and prepare Illustrator
The first step is to open and prepare Illustrator. Click on the icon for Illustrator to open it. When Illustrator opens up, go to the top menu bar and click File then New, or press Ctrl + N. The New document options dialogue will open for you to choose the properties that you want for the new document. When you have chosen the options click Ok to create it.
2] Select the Rectangular grid tool
Now that the document is created, it is now time to create the table. To create the table the Rectangular grid tool will be used. The Rectangular grid tool is located on the left tools panel. The Rectangular grid tool is in the same group as the Line segment tool, the Arc tool, the Spiral tool, and the Polar grid tool.

If the grid tool is not the visible tool at the top just click and hold the visible tool until you see the pop-out menu appear, you then click the Grid tool.
3] Click on the artboard to create the table
This is the step where the Grid tool will be used to create the table for the Table graph. You can create the table by clicking and dragging on the artboard and the table will be created. However, the ideal way to create the table would be to just click on the artboard and release it.
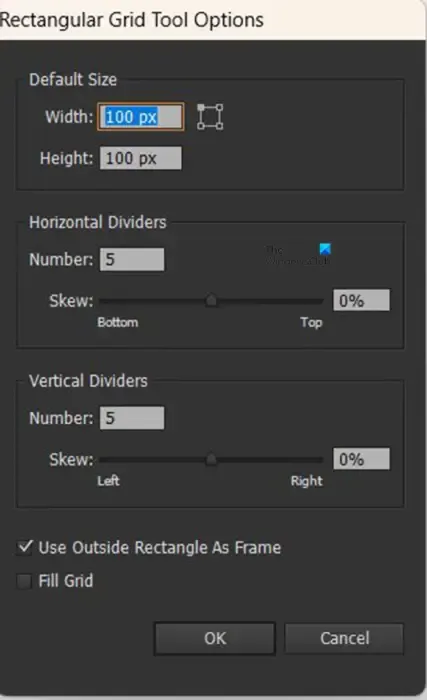
You will see the Rectangular grid tool options window appear. Here you can put in the options that you want for the table (number of rows, columns, grid fill, etc.).
Rows and Columns
The number of rows and columns will create the number of rows and columns in the table. Note that Illustrator will add one extra to the number that you place as the value of the row and column. This means that you will need to put one less than the number that you need for the row and column. For example, if you need 3 rows you will have to put 2 and if you need 4 columns you will have to put 3. Illustrator will add one extra to the numbers that you chose.
Fill grid
The Fill grid option is what you would click if you want the table to be filled with the foreground color that is on the tools panel.
Depending on the options selected for foreground color and stroke, the table will be created without a fill color or stroke. You will need to add stroke to the table to make it visible. If no stroke is there, the table will become invisible if you unselect it. If you want to have the table with the data but no strokes around the cells, you can make it have a stroke, then remove it when the data is added. If the table is empty and no stroke is there, it will become invisible when it is not selected.
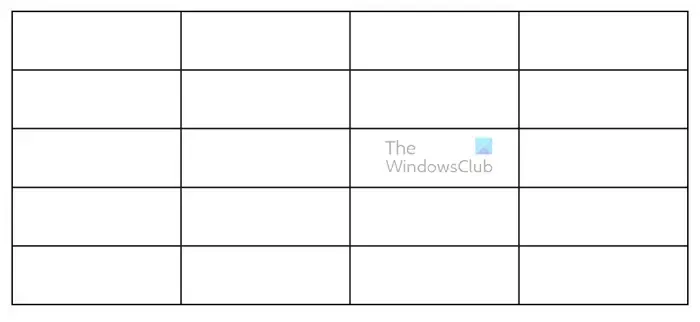
This is the table with the default size and color.
4] Add color to the table
To add some interest and functionality to the table, you can add some color. Colors can make the table graph more attractive and the colors can also be used to make the information easier to read. The Heading row can be given a different color to make it stand out. Other rows or columns can be given alternating colors to make the data they contain easier to differentiate. You can choose to fill the whole table with color or gradient, or you can just add color to selected rows or columns.
Use the Rectangle tool to add color
To add color to the table you will need to use the Rectangle tool to draw a rectangle to the height and width of the cells that you want to fill, if you want to fill all the top rows then draw the rectangle to the height and width of the top rows. You can fill the rectangle with whatever color you want.

This is the table with the colored rectangle above it before it is moved to fill the row.

This is the table with the rectangle moved to fill the top row of the table. Notice that the vertical lines of cells in the top row are missing.

You can choose to make the lines of the cells show through the colored rectangle.
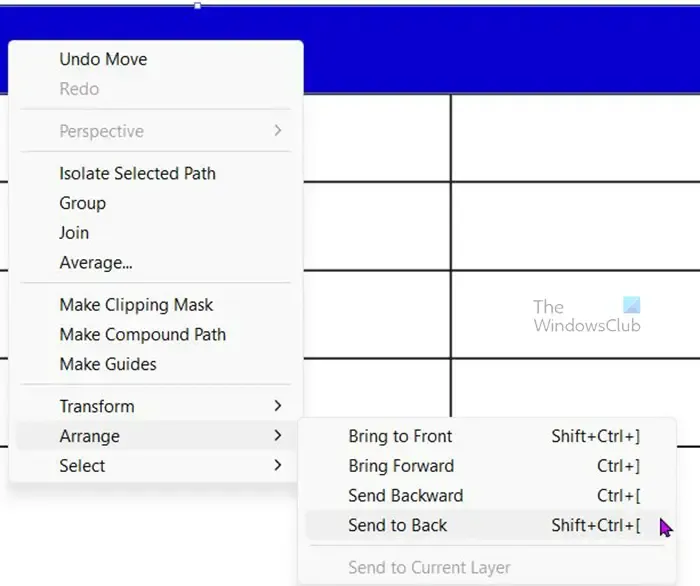
You can just right-click on the colored rectangle and click Arrange then Send to back or press Shift + Ctrl + [. This will send the rectangle to the back and bring forward the table, allowing the lines to show.
You can choose to add color to alternate rows or columns, depending on how the data will be stored in the table. Coloring alternate rows or columns makes it easier to read data in the table, especially if there is a lot of data to view.
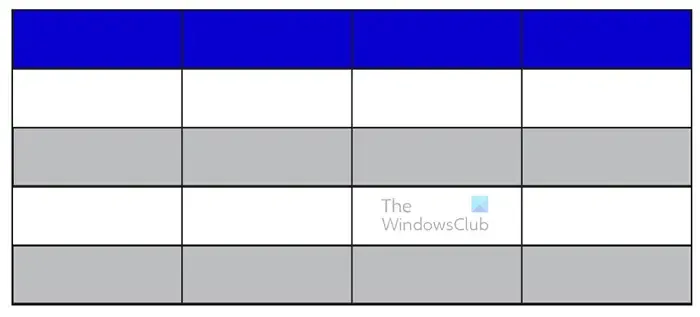
To change the colors of alternate rows or columns, follow the same steps that were used to color the top row. You can also easily add color by clicking and holding the top colored rectangle and then holding Alt as you drag it onto the first row that you want to color. When the rectangle is there press Ctrl + D to make it automatically fit all the following rows. You can then change the color of each of the other rectangles to the colors that you choose.

If you want to color columns instead of rows, you would just need to resize the rectangle to fit into rows. When you fill the first row just drag while holding alt to duplicate the rectangle into another row. When that new row is filled press Ctrl + D to repeat the step as many times as you want.
Note that you can use gradients to fill the table instead of using just colors.
5] Add data to the table
This is where you will be adding the other important part of your table graph, the data. The data can be words, numbers, or a mixture of both. Just select the Type tool on the left tools panel or press T. Begin to type in the cells that you want the data to be. Don’t worry about the fact that the data may spill into other cells or if the data is too small for the cell. In the next step, you will learn how to adjust the row and column sizes. To ensure that all the words share the same characteristics, you can hold Alt and drag to copy the word to the cell that you want it. you can then change the word to whatever you want it to be. Dragging while holding Alt will duplicate the word.
6] Adjust table rows and columns if needed
Now that the table is created, you now need to look at the table and compare it with the data and see if the table needs adjusting to hold the data. You can also adjust the table when you add the data, that way you can know exactly how to adjust. To adjust the with of the lines, select the Direct selection tool from the left tools panel then click and drag the lines that you want to move.
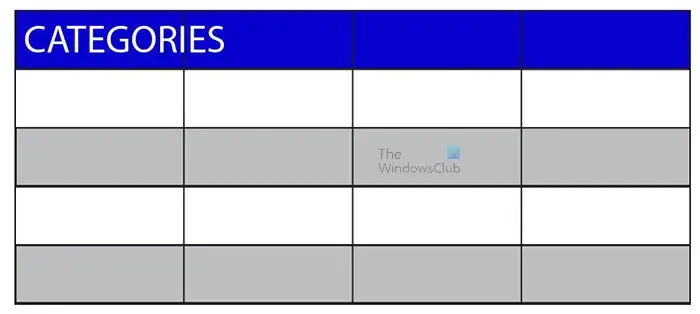
This is an example of data spilling into another cell

To adjust the lines that separate the cells you just select the Direct selection tool from the left tool panel and click and drag each line that you want to move. As you add data you will see that you will have to adjust the lines so that the data can fit properly. Above you see the table graph with all the information entered. You can make any adjustments that you want so that the data and the table can fit your preferences.
You will want to give your table graph a descriptive name. you may also want to make the heading cell have a different font from the rest of the table.
7] Group table and data
Now that the table graph has all the data that you need to add to it, you want to be able to move and resize the table and have the data do the same. To have this done easily, you need to group the table and the data. To group the data and the table, use the selection tool to select the table with the data by clicking one point outside and dragging over everything.

With all the data and the table selected, right-click, and then from the menu select Group. With the table and the data grouped. You can click to move or drag to resize and everything will be moved and resized all at once.
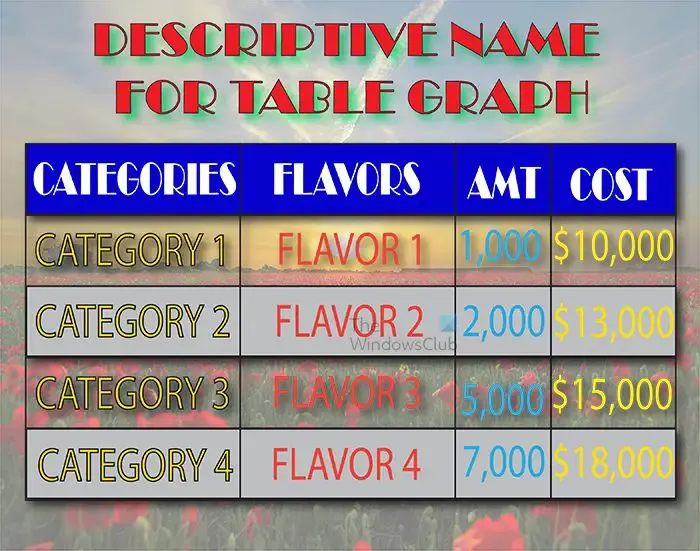
This is the completed table graph with some additions to make it interesting.
8] Save
Now that the hard work is finished, it is time to save the table graph for use in your project. The table graph can be added to presentations, word processing, websites, or other places that you may want to use it.
You may want to save the table graph in Illustrator so that it can be edited at a later date. For this, you need to give it a name and save it as an Illustrator .Ai file.
To save for use in other software like presentation software or to use on the Internet, you can export it as a JPEG or a PNG file. To export go to File then Export, from the Export window choose the save location, file name, and file format. When you have chosen these press Save.
How do you make a grid in Illustrator?
There are two ways to make a grid in Illustrator, you can either use the Rectangular grid tool or you can use the Object path option.
Rectangular Grid tool
To create a grid using the Rectangular grid tool, click the Rectangular grid tool on the left tools panel. You then click on the artboard. The grid options menu window will appear for you to choose the properties for the grid. Here you choose the rows and columns and if you want to add fill. When you are finished, press Ok to create the grid. This option allows you to adjust the lines that separate each row or column by using the direct selection tool.
Object path option
To create a grid using the Object path option, select the Rectangle tool from the tools panel. Draw the shape on the artboard to the desired size. When the shape is drawn, select the shape and go to the top menu bar and select Object then Path, and then Split into grid. The Split into grid option window will appear. here you get to choose the number of rows and columns. You can also choose to add gutters to the grid, gutters are extra spaces between the cells. When you are finished click Ok to create the grid. With this option, you can move each cell of the grid independently, and you can also add a different color to each cell.
What are grids used for in Illustrator?
Grids in Illustrator can be used to create tables and table graphs. Grids are also useful for making artwork for games that require grids or blocks. Using the Rectangular grid tool or the Split into grid option are fast and easy ways to create tables in Illustrator for whatever purposes you have in mind.
Leave a Reply