How to Create a Chart in Microsoft PowerPoint

Because charts and graphs make such beautiful visuals, you may want to include one in your Microsoft PowerPoint presentation. You can create a chart within PowerPoint or insert one you create in Excel: two easy ways to add a helpful visual.
Also helpful: moving text from Word into PowerPoint? Learn how to copy formatted text from one to the other and save yourself time!
How to Create a Chart in PowerPoint
You can set up a chart in PowerPoint and add the data for it in one complete process. This gives you an excellent way to create a chart quickly and easily.
- Select the slide where you want the chart. If you have a content block on the chart already, you’ll see the icon for “Insert Chart” that you can click to get started.

- If you have a blank slide instead, add your chart by going to the “Insert” menu and selecting “Chart” in the Illustrations group.

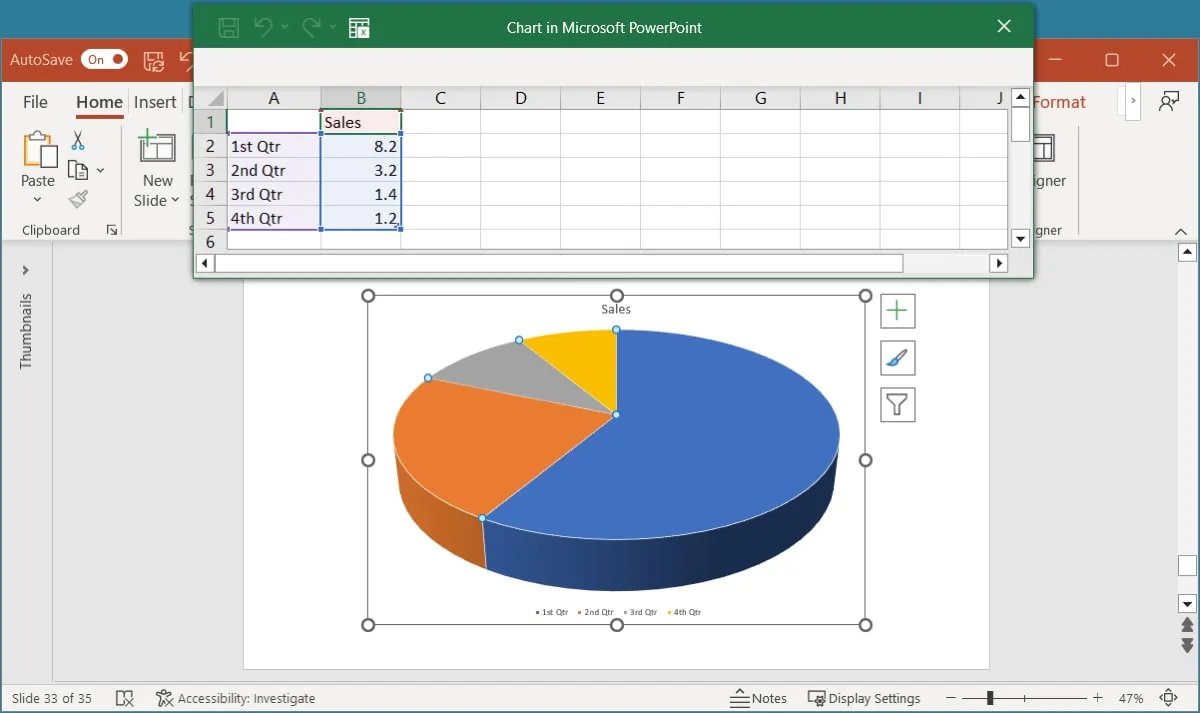
- You’ll see the Insert Chart window open with either of the above options. Choose a chart type from the left to see layouts and styles with a preview on the right and click “OK” to insert the chart. For example, we are selecting “Pie” on the left and the “3-D Pie” style on the right.

- You’ll see a spreadsheet with sample data for the selected chart type. Replace the example data with your own.

- As you adjust the data in the sheet, you’ll notice the chart update immediately. When you finish adding the data, click the “X” on the top right to close the spreadsheet.

- To edit the data for your chart later, go to the “Chart Design” tab and open the “Edit Data” menu. Select either “Edit Data” or “Edit Data in Excel.”

How to Insert an Excel Chart in PowerPoint
Maybe you already have a chart in Microsoft Excel that you’d like to use in your PowerPoint slideshow. This is as simple as a copy and paste of the chart. Depending on how you want to update the chart later, there are a handful of ways to paste the chart into PowerPoint.
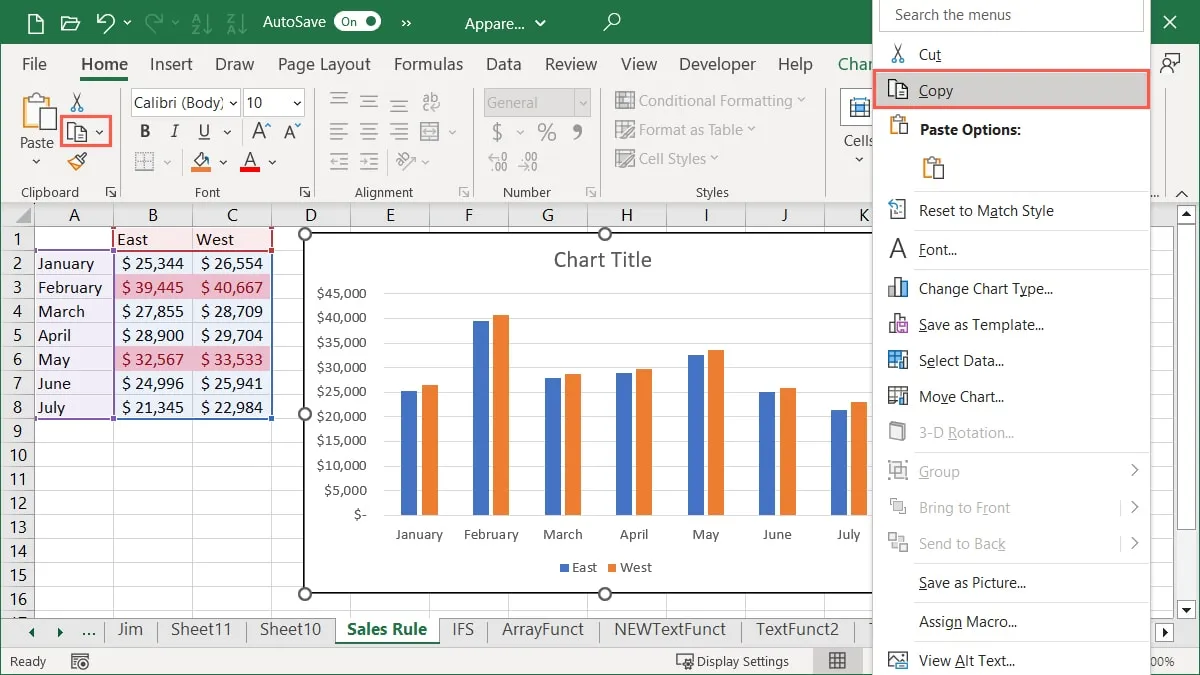
- Open your Excel sheet and select the chart, then either right-click and choose “Copy” or use the “Copy” button on the “Home” tab.

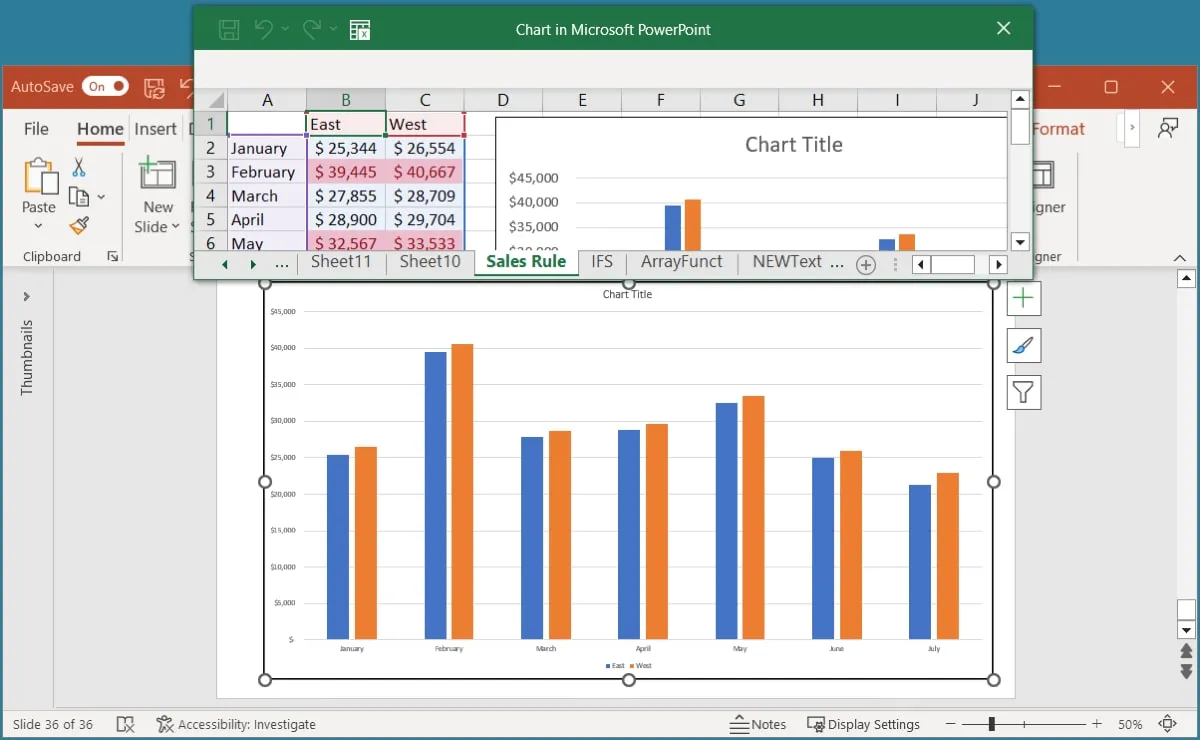
- Go to the slide in PowerPoint where you want to insert the Excel chart. Select the “Paste” drop-down arrow on the “Home” tab, then choose one of the “Paste Options” described below.

- Use Destination Theme & Embed Workbook: insert the chart with your PowerPoint theme.
- Keep Source Formatting & Embed Workbook: retain the chart’s original formatting and insert it.
With the above two options, you can edit the chart data independently without affecting the original data in Excel. Right-click the chart, select “Edit Data,” and make your changes in the sheet that appears.

- Use Destination Theme & Link Data: use your PowerPoint theme, insert the chart, and link the data.
- Keep Source Formatting & Link Data: retain the chart’s formatting, insert it, and link the data.
With the above two options, your chart will update automatically in PowerPoint when you make changes to it in Excel. You can also manually update the chart by selecting it and clicking “Refresh Data” on the “Chart Design” tab.

- Picture: insert the chart as a static image.
With the Picture option, you cannot edit or update the chart as the data changes. Like any other picture, this is a static image that is inserted in PowerPoint.

- You’ll see your chart pop onto your slide using the paste option you chose.
How to Customize a Chart in PowerPoint
Whether you create the chart in PowerPoint or paste it from Excel, you can customize its elements and appearance.
Use the Chart Design Tab
Select the chart and go to the “Chart Design” tab that is displayed. Use the tools in the ribbon to customize the chart.
- Add Chart Element: add or position items, such as axis titles, data labels, and a legend.
- Quick Layout: choose a different style or layout for the chart.
- Change Colors: choose a new color scheme for the chart.
- Chart Styles: select a design for the chart.
- Change Chart Type: choose a different type of chart or graph.

The items in the “Data” section of the ribbon may or may not be available, depending on how you paste the chart on your slide. For instance, you may be able to switch rows and columns, select the data for the chart, edit the data, or refresh the chart.
Use the Format Chart Sidebar or Format Tab
If you’d like to add a chart border, customize the font, or adjust the position or size of the chart, right-click the chart and select “Format Chart Area.” Alternatively, select the chart and use the “Format” tab.
Use the available tools to make your changes.

Use the Chart Buttons on Windows
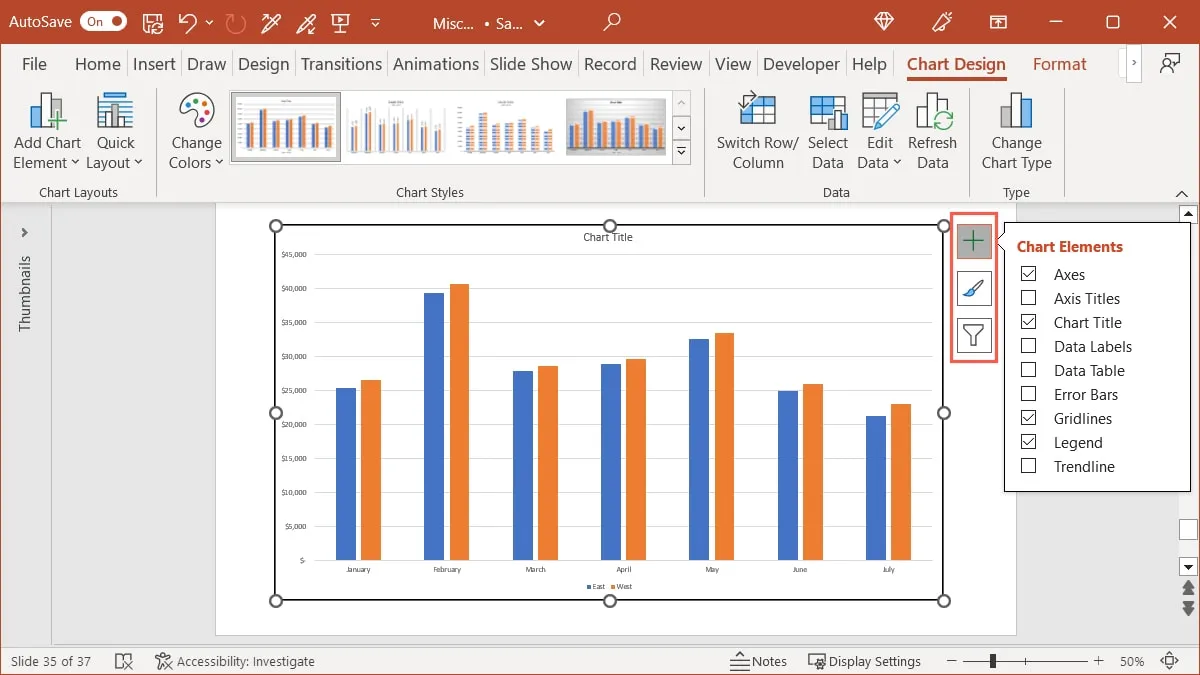
In PowerPoint on Windows, you can also use the three buttons that display to the right when you select the chart. These allow you to work with Chart Elements, Styles, and Filters.
You can add and remove items, choose a color scheme, or filter the chart according to specific data.

Frequently Asked Questions
Why do I see the Picture Format tab when I select my chart?
When you select your chart in PowerPoint, you should see the “Chart Design” tab display. If you see the “Picture Format” tab instead, it means that you pasted the chart as a picture rather than a chart.
How can I stop accidentally moving or resizing my chart?
It can be easy to mistakenly move your chart or resize it slightly as you work on your slide. To avoid this, you can lock the chart.
Right-click the chart in PowerPoint and select “Lock.” This keeps the chart in place on the slide and does not allow you to drag, move, or resize it. To undo this later, right-click and select “Unlock.”
Can I save a chart I create in PowerPoint for use elsewhere?
You can save a PowerPoint chart as an image, then insert it in another application, in an email, or in a blog post. Right-click the chart, select “Save as Picture,” and choose a location to save the image along with the picture format you want to use.
Image credit: Pixabay. All screenshots by Sandy Writtenhouse.
- Tweet
Leave a Reply